Graphical Representation of Motion
Important Questions on Graphical Representation of Motion
When a model rocket is launched, the propellant burns for a few seconds, accelerating the rocket upward. After burnout, the rocket moves upward for a while and then begins to fall. A parachute opens shortly after the rocket starts down. The parachute slows the rocket to keep it from breaking when it lands. The figure here shows velocity data from the flight of the model rocket. Use the data to answer the following.
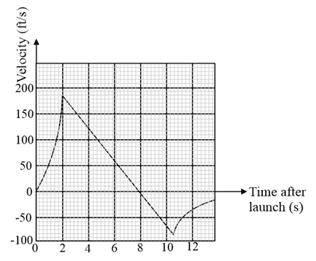
How fast was the rocket climbing when the engine stopped?
For how many seconds did the engine burn?
When did the rocket reach its highest point? What was its velocity then?
When did the parachute open up? How fast was the rocket falling then?
How long did the rocket fall before the parachute opened?
When was the rocket's acceleration greatest?
When was the acceleration constant? What was its value then (to the nearest integer)?
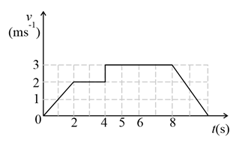
A particle starts from the origin at time and moves along the positive -axis. The graph of velocity with respect to time is shown in the figure. What is the position of the particle at time ?
All the graphs below are intended to represent the same motion. One of them does it incorrectly. Pick it up.
The graph below gives the coordinator of a particle travelling along the axis as a function of . is the tangent to the curve at the starting moment and is tangent at the end moment
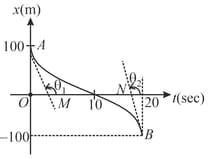
The direction or of acceleration during the first seconds is
Starting from rest at a car moves in a straight line with an acceleration given by the accompanying graph. The speed of the car at is,

The displacement-time graphs of two particles and are straight lines making angles of respectively and with the time axis. If the velocity of is and that of is , then the value of is?
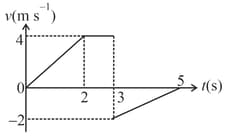
The variation of velocity of a particle moving along a straight line is shown in the figure. The distance travelled by the particle in is,

The acceleration time plot for a particle (starting from rest) moving on a straight line is shown in the figure. For given time interval,
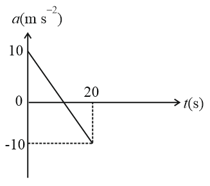
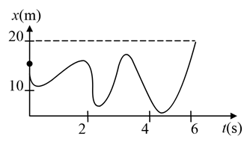
Figure shows the position of a particle moving on -axis as a function of time.
For a particle moving along -axis, the velocity-time graph is as shown in the figure. Find the distance travelled and displacement of the particle. Also, find the average velocity of the particle in interval to .