
A Bar Graph
A Bar Graph: Overview
This topic describes a bar graph. It explains that it is a way of graphically showing data using bars with rectangles. Such bars are uniform in width but vary in length or height. It also mentions that bars can be horizontal or vertical.
Important Questions on A Bar Graph
The sale of electric bulbs on different days of a week is shown below: 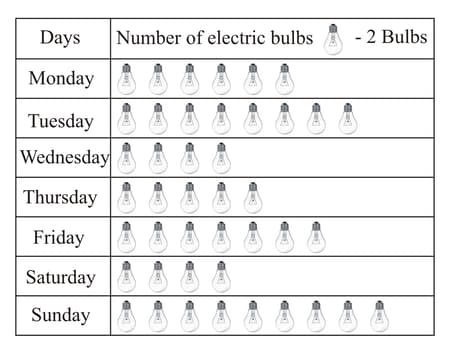
Observe the pictograph and answer the following question:
On which of the days minimum number of bulbs were sold.
Number of persons in various age groups in a town is given in the following table.
| Age group (in years) | and above | |||||
| Number of persons | lakhs | lakh thousands | lakh thousands | lakh thousands | thousands | thousands |
Draw a bar graph to represent the above information and answer the following questions.
All persons in the age group of and above are called senior citizens. How many senior citizens are there in the town?
Following table shows the number of bicycles manufactured in a factory during the years to . Illustrate this data using a bar graph. Choose a scale of your choice.
| Years | Number of cycles manufactured |
In which year were the maximum number of bicycles manufactured.
Following table shows the number of bicycles manufactured in a factory during the years to . Illustrate this data using a bar graph. Choose a scale of your choice.
| Years | Number of cycles manufactured |
In which year were the minimum number of bicycles manufactured?
Observe this bar graph which shows the marks obtained by Aziz in half-yearly examination in different subjects.
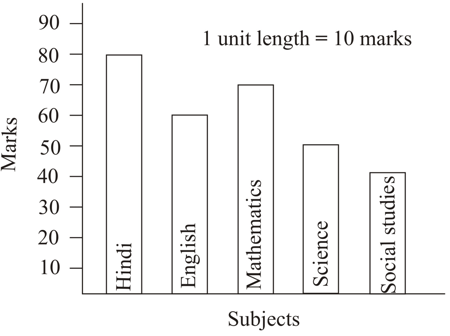
State the name of the subjects and marks obtained in each of them.
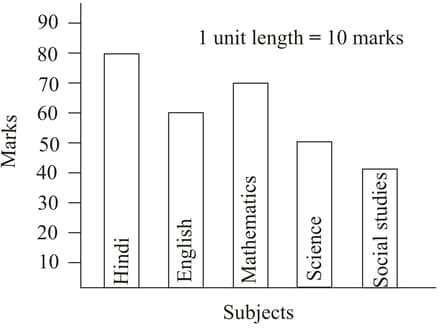
Observe this bar graph which shows the marks obtained by Aziz in half-yearly examination in different subjects.
Name the subject in which he has scored minimum marks.
Observe this bar graph which shows the marks obtained by Aziz in half-yearly examination in different subjects.
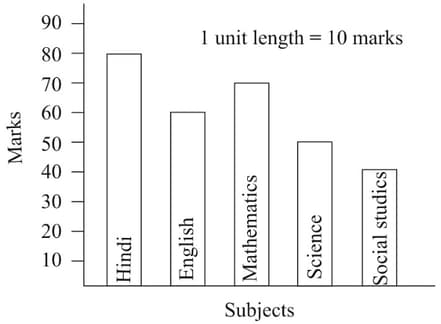
Name the subject in which Aziz scored maximum marks.
Observe this bar graph which is showing the sale of shirts in a readymade shop from Monday to Saturday.
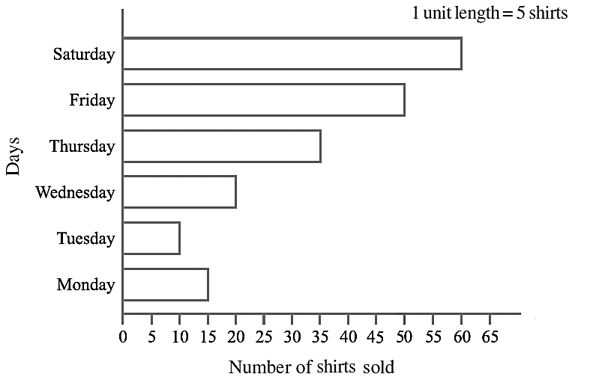
How many shirts were sold on Thursday.
Observe this bar graph which is showing the sale of shirts in a readymade shop from Monday to Saturday.
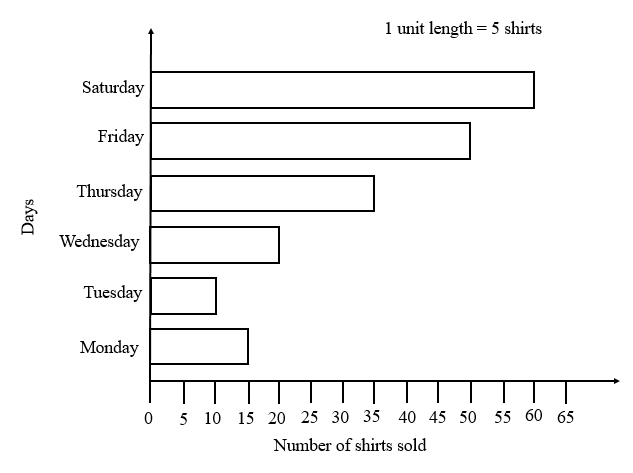
On which day were the minimum number of shirts sold.
Observe this bar graph which is showing the sale of shirts in a readymade shop from Monday to Saturday.

On which day were the maximum number of shirts sold? How many shirts were sold on that day?
Observe this bar graph which is showing the sale of shirts in a readymade shop from Monday to Saturday.
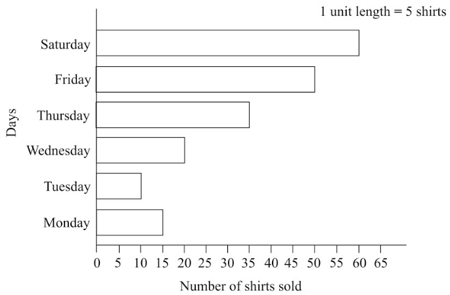
What is the scale chosen on the horizontal line representing number of shirts.
The bar graph given alongside shows the amount of wheat purchased by government during the year
Read the bar graph and write down your observations. In which year the wheat production was maximum.
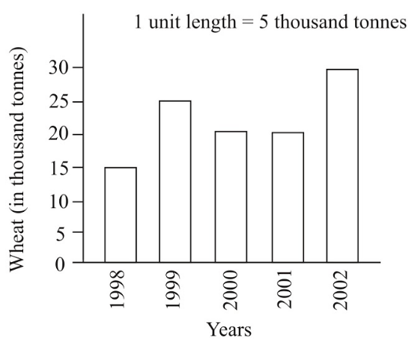
The bar graph given alongside shows the amount of wheat purchased by government during the year
Read the bar graph and write down your observations. In which year the wheat production was minimum.

In a village six fruit merchants sold the following number of fruit baskets in a particular season.
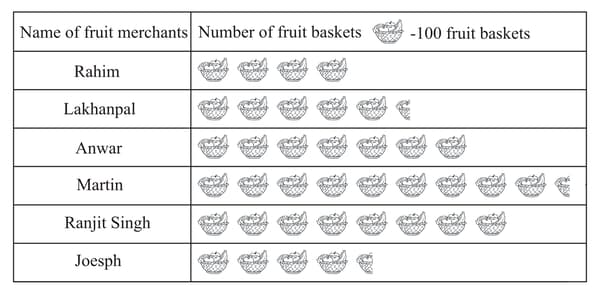
Which merchant sold the maximum number of baskets?
In a village six fruit merchants sold the following number of fruit baskets in a particular season:
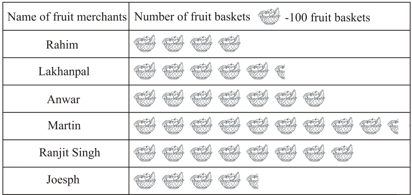
Observe this pictograph and answer the following question:
The merchants who have sold or more number of baskets are planning to buy a warehouse for the next season. Can you name them?
In a village six fruit merchants sold the following number of fruit baskets in a particular season:
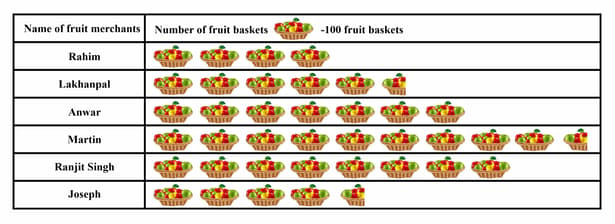
Observe this pictograph and answer the following question:
How many fruit baskets were sold by Anwar? (Give the final answer in numeral form)
The sale of electric bulbs on different days of a week is shown below:
| Days | Number of electric bulbs  - 2 Bulbs - 2 Bulbs |
|---|---|
| Monday | |
| Tuesday | |
| Wednesday | |
| Thursday | |
| Friday | |
| Saturday | |
| Sunday | |
How many bulbs were sold on Friday?
The sale of electric bulbs on different days of a week is shown below:
| Days | Number of electric bulbs  - 2 Bulbs - 2 Bulbs |
|---|---|
| Monday | |
| Tuesday | |
| Wednesday | |
| Thursday | |
| Friday | |
| Saturday | |
| Sunday | |
If one big carton can hold bulbs. How many cartons were needed in the given week?
The sale of electric bulbs on different days of a week is shown below:
| Days | Number of electric bulbs  - 2 Bulbs - 2 Bulbs |
|---|---|
| Monday | |
| Tuesday | |
| Wednesday | |
| Thursday | |
| Friday | |
| Saturday | |
| Sunday | |
How many number of bulbs were sold on Wednesday?
The sale of electric bulbs on different days of a week is shown below:
| Days | Number of electric bulbs  - 2 Bulbs - 2 Bulbs |
|---|---|
| Monday | |
| Tuesday | |
| Wednesday | |
| Thursday | |
| Friday | |
| Saturday | |
| Sunday | |
On which day were the maximum number of bulbs sold?


