
Linear Graphs
Important Questions on Linear Graphs
Draw the graph of the following table. Is it a linear graph?
Explain on which side of the point lies?
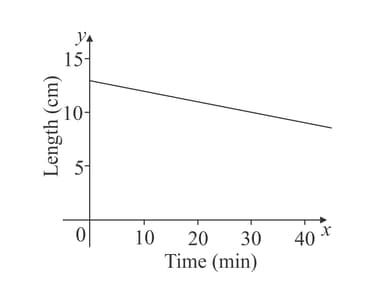
This graph shows the length of a burning candle. How much does the length of the candle decrease every minute.
The ordinate of the point is _____.
The points and lie in the
Write and coordinates of the given point .
The _____ of the origin are .
The following table gives the quantity of petrol and its cost.
| Quantity of petrol (in ) | ||||
| Cost of petrol (in ) |
The graph given below is showing the above data.
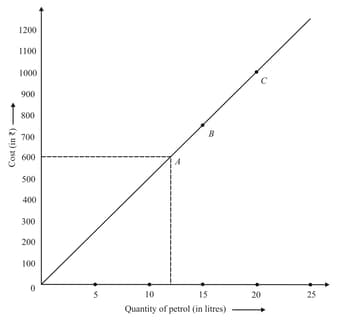
Here, the dependent variable is _____ of petrol.
The following table gives the quantity of petrol and its cost.
| Quantity of petrol (in ) | 10 | 15 | 20 | 25 |
| Cost of petrol (in ) | 500 | 750 | 1000 | 1250 |
The graph given below is showing the above data.
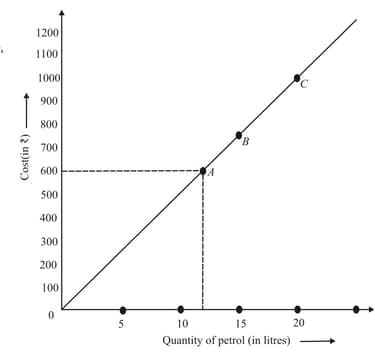
The number of litres of petrol is taken on _____ axis.
Points and lies on a line, which is _____ to -axis.
The following line graph represents the total runs scored by two batsmen during each of the ten different matches in the year.
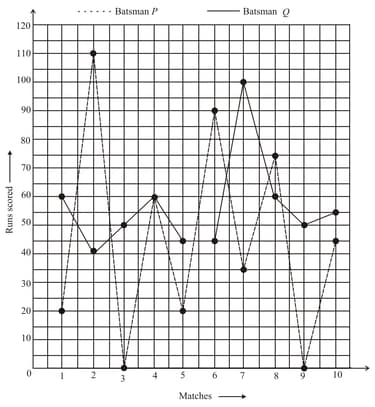
The horizontal axis (or the -axis) indicates the matches played during the year .
The _____ axis (or the -axis) shows the total runs scored in each match.
Write the -coordinate (ordinate) of .
When the points plotted on a graph that are joined together produce a straight line, we obtain a _____ graph. (linear/non-linear)
The point is called the _____.
The point (_____) lies on the -axis.
The point (_____) lies on the -axis.
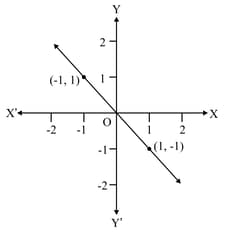
Choose the equation whose graph is given here:
Which of the following pairs of points have a distance units between them?
The point lies
Which of the following is true?


