
Natasha Awada, Paul La Rondie, Laurie Buchanan and, Jill Stevens Solutions for Chapter: Modelling Relationships: Linear and Quadratic Functions, Exercise 41: Exercise 3O
Natasha Awada Mathematics Solutions for Exercise - Natasha Awada, Paul La Rondie, Laurie Buchanan and, Jill Stevens Solutions for Chapter: Modelling Relationships: Linear and Quadratic Functions, Exercise 41: Exercise 3O
Attempt the free practice questions on Chapter 3: Modelling Relationships: Linear and Quadratic Functions, Exercise 41: Exercise 3O with hints and solutions to strengthen your understanding. Mathematics : Analysis and Approaches Standard Level Course Companion solutions are prepared by Experienced Embibe Experts.
Questions from Natasha Awada, Paul La Rondie, Laurie Buchanan and, Jill Stevens Solutions for Chapter: Modelling Relationships: Linear and Quadratic Functions, Exercise 41: Exercise 3O with Hints & Solutions
Use the information shown in the graph to find an expression for the quadratic function. Write your final answer in the form .
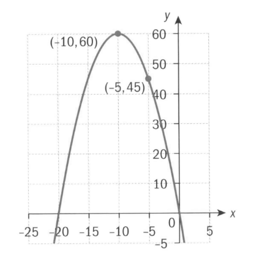
The graph of quadratic function has -intercepts and . The function has a maximum value of .
Find the equation of the axis of symmetry for the graph of .
The graph of quadratic function has -intercepts and . The function has a maximum value of .
Write down the coordinates of the vertex for the graph of .
The graph of quadratic function has -intercepts and . The function has a maximum value of .
Find an equation for in the form of , where are constants to be determined.
The graph of quadratic function has -intercepts and . The function has a maximum value of .
A translation of the graph of right units and down units results in graph of . find an expression for the function in the form of .
The table and graph are representations of the predicted height, metres, of a model rocket, seconds after it is launched.
| Time after launch | Height |
Write down the coordinates of the vertex of the graph and then explain its meaning in terms of the context of the graph.

The table and graph are representations of the predicted height, metres, of a model rocket, seconds after it is launched.
| Time after launch | Height |
Find an equation for and give the domain.
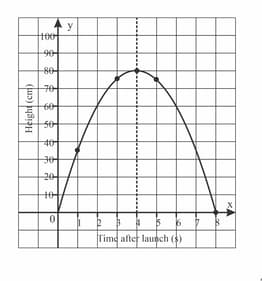
The table and graph are representations of the predicted height, metres, of a model rocket, seconds after it is launched.
| Time after launch | Height |
If the predicted height of the model rocket seconds after launch is metres. find the value of .


