
S K Khanuja Solutions for Chapter: Bar Graphs, Exercise 4: Exercise 67
S K Khanuja Mathematics Solutions for Exercise - S K Khanuja Solutions for Chapter: Bar Graphs, Exercise 4: Exercise 67
Attempt the free practice questions on Chapter 23: Bar Graphs, Exercise 4: Exercise 67 with hints and solutions to strengthen your understanding. Tryout Maths A book on Mental Maths 7 solutions are prepared by Experienced Embibe Experts.
Questions from S K Khanuja Solutions for Chapter: Bar Graphs, Exercise 4: Exercise 67 with Hints & Solutions
Look at the bar graph given below:
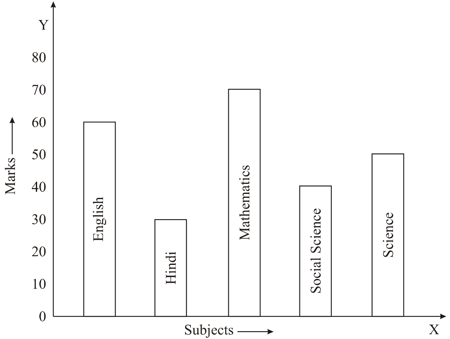
Observe it carefully and answer the given question:
What information does the bar graph give?
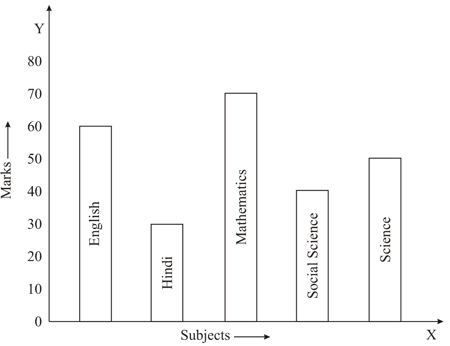
Look at the bar graph given below.

In which subject the student performed well?
Look at the bar graph given below:
In which subject student performance is poor?
Look at the bar graph given below:
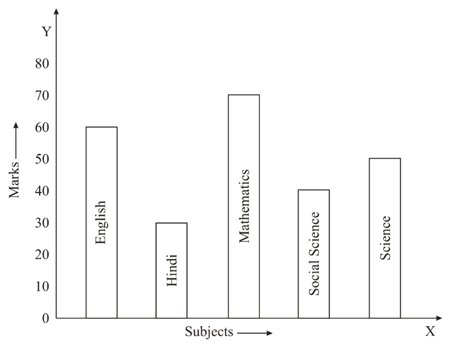
Observe it carefully and answer the following question.
What is the average of marks?
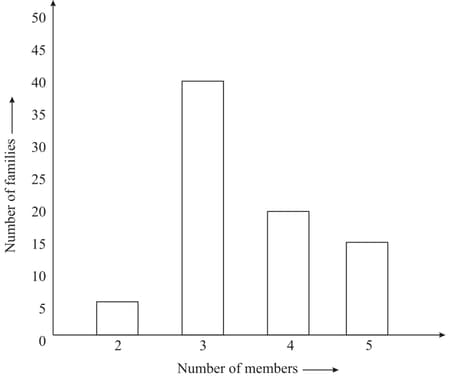
In a survey of families of a colony, the number of members in each family was recorded and the data has been represented by the following bar graph:
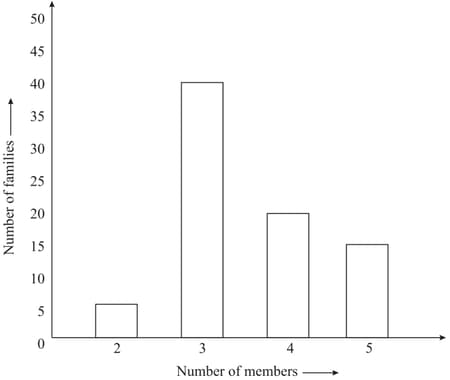
Read it carefully and answer the following question:
What information does the bar graph give?
In a survey of families of a colony, the number of members in each family was recorded and the data has been represented by the following bar graph where represents number of members in a family and in is families.

How many families have members?
In a survey of families of a colony, the number of members in each family was recorded and the data has been represented by the following bar graph:

Read it carefully and answer the following question:
How many people live alone?
In a survey of families of a colony, the number of members in each family was recorded and the data has been represented by the following bar graph:
Read it carefully and answer the following question:
Which type of family is the most common?


