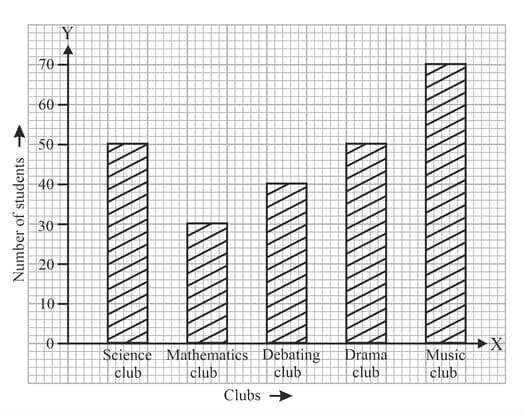
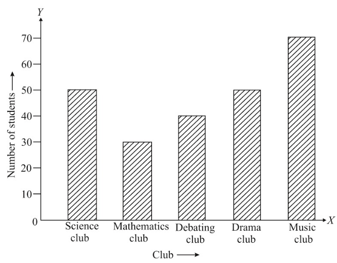
Figure is a bar graph showing the number of students in different clubs of the school:
Read the bar graph carefully and answer the given question.
What information does the bar graph give?
Important Questions on Data Handling II Bar Graphs and Histograms
The figure is a bar graph showing the number of students in different clubs of the school:
Which club has the least number of members? (Science / Mathematics / Debating / Drama / Music)
The figure is a bar graph showing the number of students in different clubs of the school:
_____ club is most popular among the students.
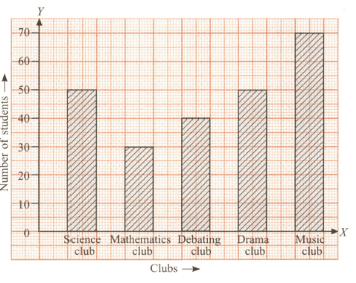
Figure is a bar graph showing the number of students in different clubs of the school:
How many students are the members of the Science club and the Music club put together?
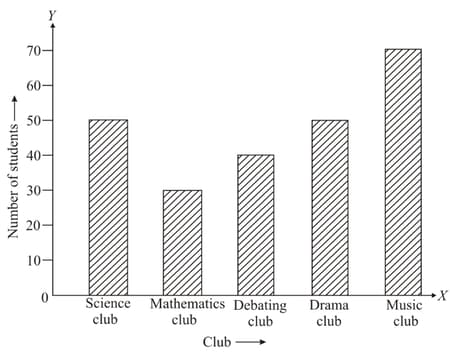
Figure is a bar graph showing the number of students in different clubs of the school:
Read the bar graph carefully and answer the given question.
What is the total number of members in various clubs?
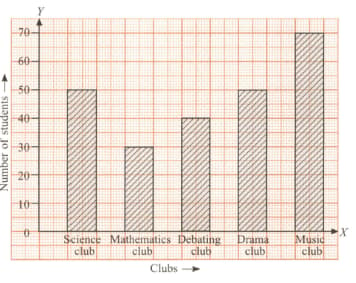
Figure is a bar graph showing the number of students in different clubs of the school:
Read the bar graph carefully and answer the given question.
What percentage of students are the members of the Mathematics club?

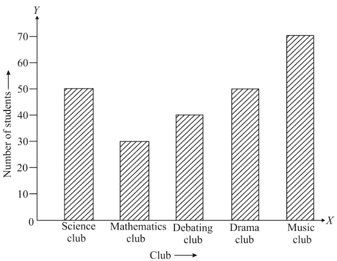
Figure is a bar graph showing the number of students in different clubs of the school:
Read the bar graph carefully and answer the given question.
If the membership fee for each club is then what is the total amount collected by the Drama club?
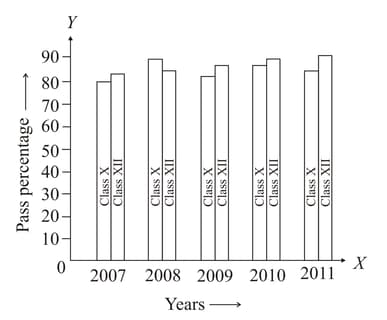
Read the double bar graph given and answer the following question.
What information is given by the double bar graph?
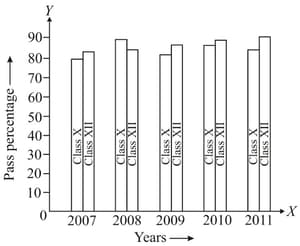
Read the double bar graph given in figure and answer the given question.
In which year is the pass percentage of Class maximum?