
Histogram represents numerical data whereas the bar graph represents data.
Important Questions on Statistics
The given pie-chart depicts the expenditure incurred in towards each sport.
Expenses (in )

In the given pie-chart, what is the ratio of expenditure between hockey and gymnastics?
The pie-chart represented below shows the spending by a family on various items during the year . Study the pie-chart carefully and answer the following question:

According to the pie-chart, the maximum amount was spent on which item?
The pie-chart represented below shows the spending by a family on various items during the year . Study the pie-chart carefully and answer the following question:

The ratio of the total amount of money spent on housing to the total amount of money spent on education was
The pie-chart represented below shows the spending by a family on various items during the year . Study the pie-chart carefully and answer the following question:

If the total amount spent during the year was , then the amount (in rupees) spent on food was
The pie-chart represented below shows the spending by a family on various items during the year . Study the pie-chart carefully and answer the following question:

If the total amount spent during the year was then how much money (in rupees) was spent on clothing and housing together?
The pie-chart represented below shows the spending by a family on various items during the year . Study the pie-chart carefully and answer the following question:
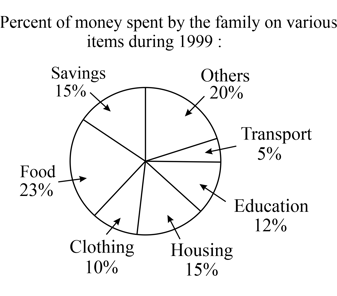
If the total expenditure of the family for the year was , then the savings (in rupees) of the family was
The given pie-chart depicts the expenditure incurred in towards each sport.
Expenses (in )
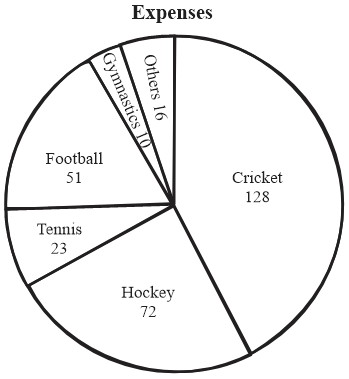
In the given pie-chart, what is the difference between the expenditure incurred on cricket and football?
The given pie-chart depicts the expenditure incurred in towards each sport.
Expenses (in )
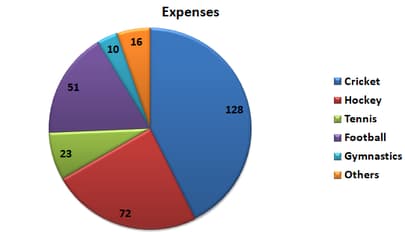
In the given pie-chart, what will be the central angle of the sector representing football?
The graph below shows the speed, in m/s, of a car as it comes to rest from a speed of m/s.

Calculate the rate at which the car is slowing down during the first three seconds.
A random survey of the number of children of various age groups playing in park was found as follows:
| Age(in years) | Number of children |
Draw a histogram to represent the data above.
The distance-time graph represents Ibrahim's journey home to school one morning.
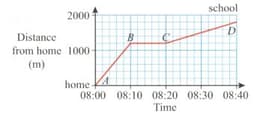
How fast, in m/s, was Ibrahim traveling during the last 20 minutes?
The graph below shows the speed, in m/s, of a car as it comes to rest from a speed of m/s.
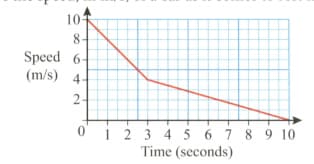
Calculate the average speed of the car for this second period.
The following table gives the lifetimes of neon lamps:
| Length (in hours) | Number of lamps |
Represent the given information with the help of a histogram.
The distance-time graph represents Ibrahim's journey home to school one morning.

Describe the stage of Ibrahim's journey represented by the line BC.
The runs scored by two teams and on the first balls in a cricket match are given below:
| Number of balls | Team A | Team B |
Represent the data of both the teams on the same graph by frequency polygons.
The diagram below is the speed-time graph for a car journey.
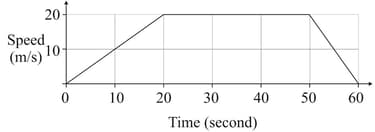
Calculate the acceleration during the last seconds of the journey.
Given below are the seats won by different political parties in the polling outcome of a state assembly election:
| Political Party | ||||||
| Seats Won |
Draw a bar graph to represent the polling results.
A survey conducted by an organization for the cause of illness and death among the women between the ages (in years) worldwide, found the following figures (in ):
| S.No. | Causes | Female fatality rate () |
| Reproductive health conditions Neuropsychiatric conditions Injuries Cardiovascular conditions Respiratory conditions Other causes |
Represent the information given above graphically.


