
Marks obtained out of in Science paper by students are given in the following table:
Marks
Number of students
Represent the above information by a bar graph and answer the following question:
Every student getting the highest marks is entitled to get a prize of . How much money is required for distributing the prizes?
Important Questions on Bar Graphs
Marks obtained out of in Science paper by students are given in the following table:
| Marks | |||||
| Number of students |
Represent the above information by a bar graph and answer the following question:
Students obtaining the lowest marks have to solve problems per day. How many problems in all will be solved by the students per day?
Look at the bar graph given below:
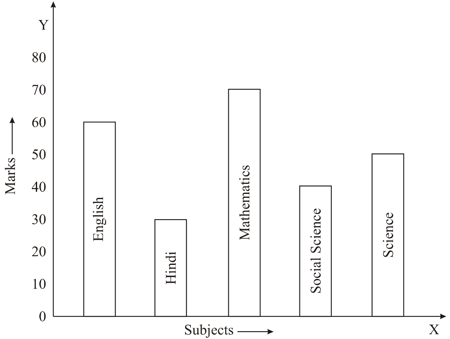
Observe it carefully and answer the given question:
What information does the bar graph give?
Look at the bar graph given below.

In which subject the student performed well?
Look at the bar graph given below:
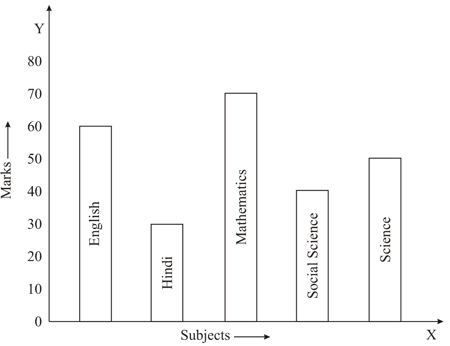
In which subject student performance is poor?
Look at the bar graph given below:
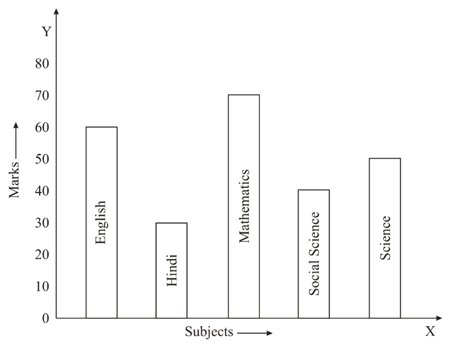
Observe it carefully and answer the following question.
What is the average of marks?
In a survey of families of a colony, the number of members in each family was recorded and the data has been represented by the following bar graph:
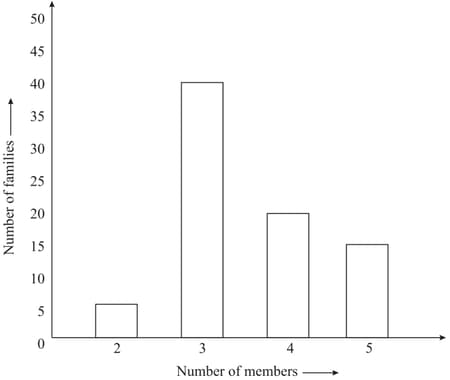
Read it carefully and answer the following question:
What information does the bar graph give?

How many families have members?
In a survey of families of a colony, the number of members in each family was recorded and the data has been represented by the following bar graph:
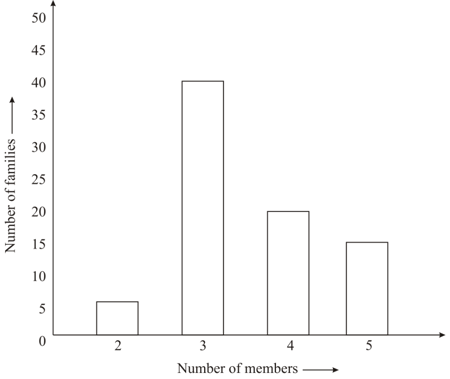
Read it carefully and answer the following question:
How many people live alone?


