
The equation representing -axis is
Important Questions on Graphs
The diagram given below shows two graphs and used by two different companies to find the cost of fare charges for journeys up to kilometres. Use the given graph to answer the following questions.
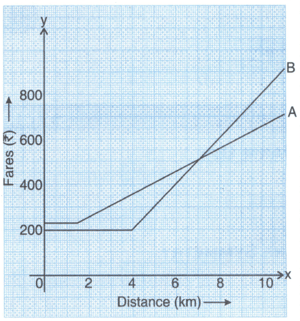
With reference to the graph , what is the cost for a journey of and
The diagram given below shows two graphs and used by two different companies to find the cost of fare charges for journeys up to kilometres. Use the given graph to answer the following questions.

If the cost of another journey is , how far is the journey with reference to the graph ?
The diagram given below shows two graphs and used by two different companies to find the cost of fare charges for journeys up to kilometres. Use the given graph to answer the following questions.

For what distances would it be cheaper to use the service provided by the second company, as shown by the graph ?
The diagram given below shows two graphs and used by two different companies to find the cost of fare charges for journeys up to kilometres. Use the given graph to answer the following questions.

What is the difference in fare charges between the two companies for a distance of ?
Ankit can ride a scooter constantly at a speed of . Draw a distance-time graph for this situation. Use it to find the time taken by Ankit to ride .
You can use the following table of values:
| Time (in hours) | |||||
| Distance covered (in km) |
Ankit can ride a scooter constantly at a speed of . Draw a distance-time graph for this situation.
You can use the following table of values:
| Time (in hours) | |||||
| Distance covered (in km) |
The distance covered by Ankit in hours.
Distances can be given in feet and in metres. The graph shows the relationship between feet and metres.
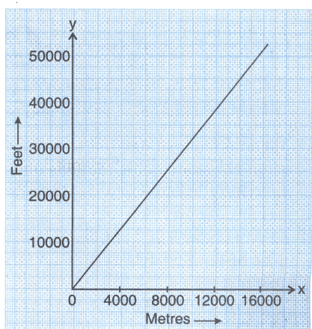
A mountain is feet high. What is its height in metres?
Distances can be given in feet and in metres. The graph shows the relationship between feet and metres.

A plane is flying at a height of . What is its height in feet?


