
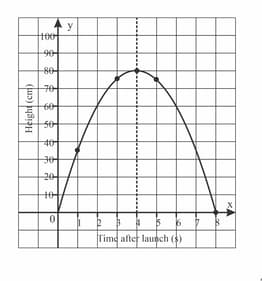
The table and graph are representations of the predicted height, metres, of a model rocket, seconds after it is launched.
Time after launch
Height
Write down the coordinates of the vertex of the graph and then explain its meaning in terms of the context of the graph.

Important Questions on Modelling Relationships: Linear and Quadratic Functions
The table and graph are representations of the predicted height, metres, of a model rocket, seconds after it is launched.
| Time after launch | Height |
Find an equation for and give the domain.
The table and graph are representations of the predicted height, metres, of a model rocket, seconds after it is launched.
| Time after launch | Height |
If the predicted height of the model rocket seconds after launch is metres. find the value of .

Solve by factorization:
Solve by factorization:
Solve by factorization:
Solve by factorization:
Solve by factorization:
Solve by factorization:


