
Interquartile Range and Percentiles
Interquartile Range and Percentiles: Overview
This topic covers concepts, such as, Outlier, Finding Interquartile Range from Stem-and-leaf Diagram, Finding Percentiles from Cumulative Frequency Curve & Quartile of Grouped Data etc.
Important Questions on Interquartile Range and Percentiles
Calculate and from the following grouped data.
| Class | Frequency |
If total number of data sets are , then the percentiles of a given set of data fall within is _____.
A set of numbers may be as follows: . Find the interquartile range .
| Frequency: | Cumulative Frequency: |
Calculate and from the following grouped data.
| Class | Frequency |
Identify any outliers for the given set of data.
If total number of data sets are , then how many of a given set of data fall within .
A set of numbers may be as follows: . Find lower, upper quartile and interquartile range .
| Frequency: | Cumulative Frequency: |
Identify any outliers for the given set of data.
adults are selected at random, and each is asked to state the number of trips abroad that they have made.
The results are shown in the back-to-back stem-and-leaf diagram.
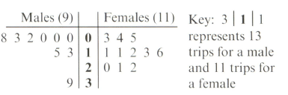
Interpret the key features of the data represented in your diagrams and compare the data for the groups of adults.
Find the sum of lower quartile and upper quartile for the data set:
Find upper quartile for the data set:
Find lower quartile for the data set:
The difference between the values of the first and third quartiles is called Inter quartile range.


