
Graph of Linear Equation
Graph of Linear Equation: Overview
Through this topic, we will learn about the graphs of a linear equation. We will understand how to find the equations of a line by plotting the points on the graph. We will also discuss how to draw the graph from its equation.
Important Questions on Graph of Linear Equation
Which one of the following graphs is for the function ?
Aana is trying to find the value of "" for which and satisfy the linear graph of equation . Can you help her by choosing the correct value of ?
Ishin has the linear equation . Help her to draw the linear equation on the graph.
Find the area of the plane region formed by the graphs of the equations and .
Using the graph of equation, find the sum of the co-ordinates of the point where the graph intersects the axis.
Draw the graph of the following equation:
Draw the graph of the following equation:
Draw the graph of the following equation:
Draw the graph of the following equation:
The graph given alongside shows the relation between pounds and kilograms.
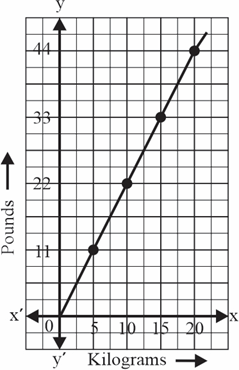
A bag of rice weighs . According to the graph, if its weight is pounds, find .
Make a line graph for the area of a square as per the given table.
| Side(in ) | ||||
| Area(in ) |
The cost of a notebook is . Draw a graph after making a table showing cost of ..... notebooks. Use it to find the number of notebooks that can be purchased with .
The cost of a notebook is . Draw a graph after making a table showing cost of ..... notebooks. Use it to find the cost of notebooks.
If coordinate is times coordinate, form a table for it and draw a graph.
If -coordinate is times of -coordinate, then form a table for it and draw a graph.
A daffodil grows m every day. Plot the growth of the flower if the initial length of the daffodil is and hence give the length of the daffodil on the day.
On the same sheet of graph paper, draw the lines . Find the coordinates of the points of intersection of the four lines. Name the figure you get.
The following table gives the relationship between Celsius and Fahrenheit temperatures. Draw a linear graph to represent the relationship. From the graph, determine the temperature at which the Celsius and Fahrenheit temperatures have the same value.
Sohail started saving money every month. He saved in January and more in every following month. Draw a graph to show his savings for the first half of the year.
In which month will he be able to save ?
Sohail started saving money every month. He saved in January and more in every following month. If he is not taking out money from his savings, and saved by August, then find the value of .


