
Pie Charts
Important Questions on Pie Charts
The pie chart shows the proportions of students by age in a class. There are students who are years old.

Find the number of students who are years old.
The pie chart shows the proportions of students by age in a class. There are students who are years old.

Find the total number of students in the class,
The pie chart shows the proportions of students by age in a class. There are students who are years old.
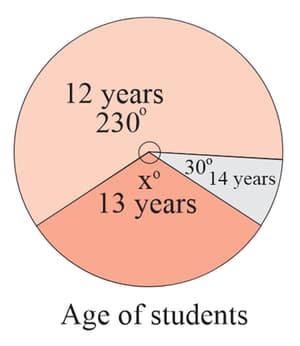
Find the value of ,
A shop sells three grades of coffee, which are Platinum, Gold and Silver. The pie chart represents the weight (in ) of each grade of coffee sold on a particular day. The total weight of coffee sold was .
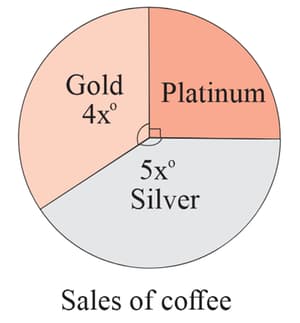
Find the value of .
The pie chart shows the favourite subjects of students.

Find the number of students whose favourite subject is 'English'.
The pie chart shows the favourite subjects of students.
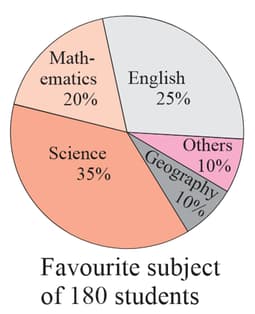
Which subject do most students like?
The pie chart shows how some students travel from home to school.
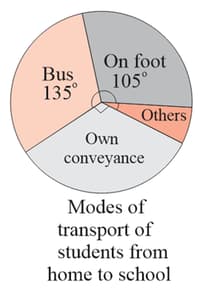
By which mode do most of the students travel from home to school?
In a survey, each interviewee was asked about his/her favourite fruit juice. The results are shown on the given pie chart.
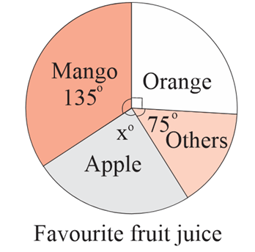
If interviewees selected apple juice, find the number of interviewees who chose orange juice.
In a survey, each interviewee was asked about his/her favourite fruit juice. The results are shown on the given pie chart.
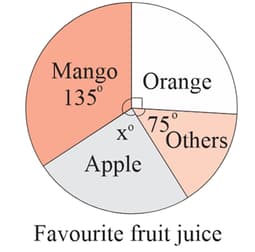
If interviewees selected apple juice, find the total number of interviewees,
In a survey, each interviewee was asked about his/her favourite fruit juice. The results are shown on the given pie chart.

Find the value of .
In a state government's expenditure in the year , the economic development expenses can be subdivided into categories as given in the table below.
| Category | Transport | Trade and Industry | Manpower | Info-communications technology and media development |
| Expenses (in crore ) |
Construct a pie chart to represent the data.


