
Grouping Data
Important Questions on Grouping Data
The number of hours for which students of a particular class watched television during holidays is shown through the given graph.

How many students spent more than hours in watching TV?
The number of hours for which students of a particular class watched television during holidays is shown through the given graph.

How many students watched TV for less than hours?
The number of hours for which students of a particular class watched television during holidays is shown through the given graph.
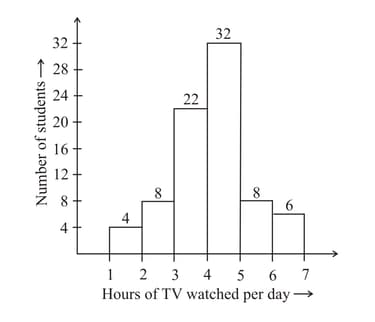
If the maximum number of students watch the TV for , then find the value of
Draw a histogram for the following data and answer the following question.
The weekly wages (in ) of workers in a factory are.
How many workers earn less than ?
Draw a histogram using the frequency table of the following data and answer the following question.
The weekly wages (in ) of workers in a factory are.
How many workers earn and more?
Can we use the histogram to show the following data? Give reason.
The number of passengers boarding trains from to at a station.
Can we use the histogram to show the following data? Give reason.
The number of cassettes produced by companies.
Can we use the histogram to show the following data? Give reason.
The height of competitors in athletics meet.
Construct a frequency distribution table for the data on weights (in ) of students of a class using intervals and so on.
Draw a histogram for the given data, using the frequency table and answer the following question.
The weekly wages (in ) of workers in a factory are.
Which group has the maximum number of workers?
The weekly wages (in ) of workers in a factory are.
Using tally marks make a frequency table with intervals as and so on.
The shoppers who come to a departmental store are marked as: man(M), woman (W), boy (B) or girl (G). The following list gives the shoppers who came in the first hour in the morning:
W W W G B W W M G G M M W W W W G B M W B G G M W W M M W W W M W B W G M W W W W G W M M W W M W G W M G W M M B G G W
Make a frequency distribution table using tally marks. Draw a bar graph to illustrate it.
Would you use a histogram to show the following data? Give reason.
The number of letters for different areas in a postman’s bag.


