
Mode of Grouped Data
Mode of Grouped Data: Overview
In this topic, you will learn about the computation of mode of a discrete frequency distribution and frequency distribution with class interval.
Important Questions on Mode of Grouped Data
The marks obtained by a set of students in an exam are recorded in a grouped frequency table. The maximum number of students are found to be in the range of marks.
If the number of students in the ranges before and after the range are equal, which of the following is the mode of the data?
Find the mode for the continuous data given below.
| Class | |||||
| Number of people |
Where,
, is the median for the grouped data given below.
Find the mode for the continuous data given below.
| Class | |||||
| Number of people |
Where,
, is the median for the grouped data given below.
Find the mode for the continuous data given below.
| Class | |||||
| Number of people |
Where,
, is the median for the grouped data given below.
Find the mode for the continuous data given below.
| Class | |||||
| Number of people |
Where,
, is the mean for the ungrouped data given below.
Find the mode for the continuous data given below.
| Class | |||||
| Number of people |
Where,
, is the mean for the ungrouped data given below.
Find the mode for the continuous data given below.
| Class | |||||
| Number of people |
Where,
, is the mean for the ungrouped data given below.
In the following question given below, on solving the given statement, we get quantities and , solve both quantities and choose the correct option.
Quantity Find the mode value of the data given below:
Quantity Find the mode value for the ungrouped data given below:
For the following data:
If the median of the ungrouped data is , and .
Find the mode for the given grouped frequency distribution.
Table
Where,
, is the mean for the grouped frequency distribution given below.
Table
Find the mode for the given grouped frequency distribution.
Table
Where,
, is the mean for the grouped frequency distribution shown in table , and the value of is more than the value of .
Table
Find the mode for the given grouped frequency distribution.
Table
Where,
, is the mean for the grouped frequency distribution given below.
Table
The mode of the data is:
Data about the times, in seconds, taken to run metres by adults are given in the following table.
| Time | |||
| No. adults |
By first investigating the possible values of and of find the largest possible value of given that the modal class contains the slowest runners.
Four classes of continuous data are recorded as and The class has a frequency of and there is no modal class. Find the total frequency of the other three classes.
The histogram shows the lengths of black rats.
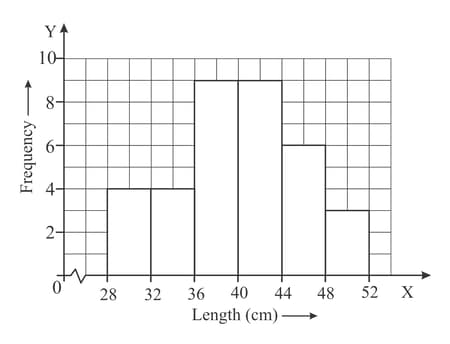
The modal class is
Height in cms:
No. of students:
Modal group is
Find the mode of the following data :
| Marks | No. of students |
Find the mode of the following data :
| MARKS | No. of students |
Find the mode of the following data :
| Weight | No. of students |
Find the mode of the following data :
| Family size | No. of families |


