Frequency Polygon and Frequency curve
Frequency Polygon and Frequency curve: Overview
This topic covers concepts such as frequency polygon, and relation between histogram and frequency polygon.
Important Questions on Frequency Polygon and Frequency curve
Directions— Study the following graph carefully to answer the questions that follow— The following line graph gives the distance (in ) travelled by five different trucks in a day.
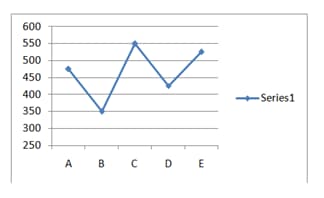
If Truck C covered the given distance at the average speed of what was the time taken by it to cover this distance?
In the following table the number of students passed in different subjects is given.
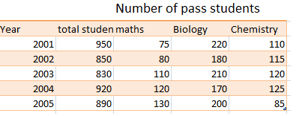
What is the average maths students who passed in
Study the following graph carefully to answer the questions—The following Bar graph gives the number of products manufactured and sold by a company over the years. (in thousands)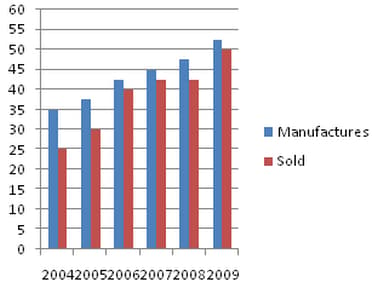
What is the average number of products manufactured by the company over all the years together ?
DIRECTIONS : The adjacent histogram shows the average pocket money received by students for a span of one month. Study the diagram and answer the question.
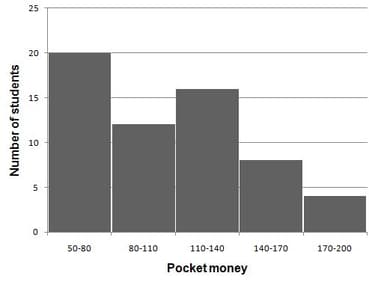
Maximum number of students received pocket money between ______
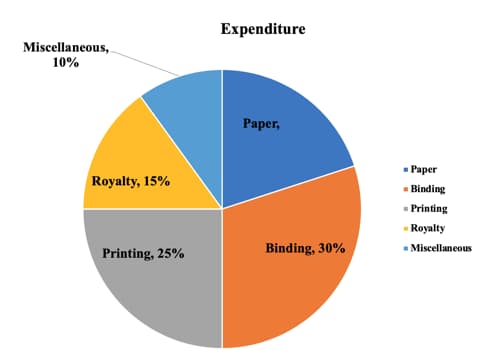
Directions: The pie-chart drawn below shows the spending's of a country on various sports during a particular year. Study the pie-chart carefully and answer the questions given below it.
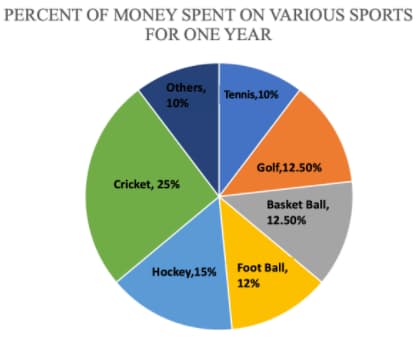
If the total amount spent on sports during the year was , the amount spent on cricket and hockey together was
Examine the given graph and answer these questions:
Production of agricultural machinery by a company. (in thousands)
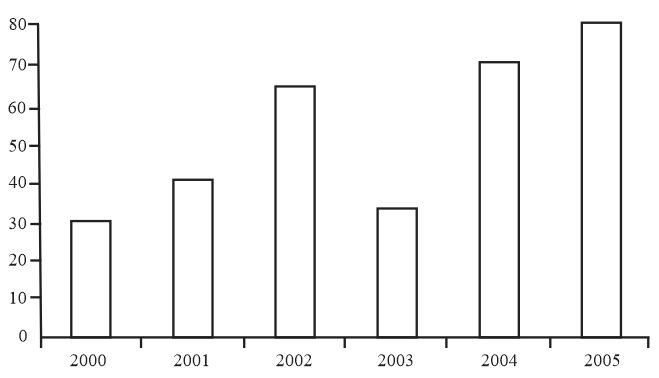
The average production by the company all over the years was:
Directions: Study the graph carefully to answer the questions that follow
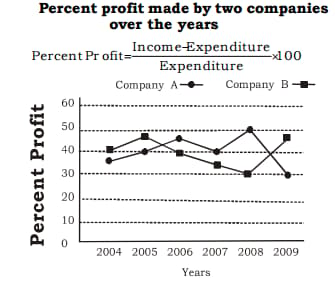
What is the ratio of the amount of profit earned by Company A to that by company B in the year
Directions Study the following graph and answer the questions given
Result of Annual Examination In a High School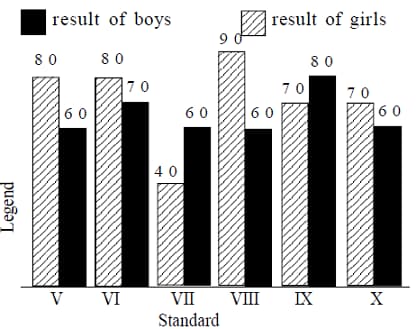
In which standard is the result of boys more than the average result of the girls?
Directions— Study the following graph carefully to answer the questions that follow— The following line graph gives distance (in ) travelled by five different trucks in a day.

All the trucks together, then what is the average distance to be travelled?
Study the following pie chart and answer the question based on it-
Study the following table and answer the questions based on it:
(In lakhs of ` )
XYX CO.PVT.LTD
|
Years |
Total Sales |
Gross Profit |
Net Profit |
|
|
|
|
|
|
|
|
|
|
|
|
|
|
|
|
|
|
|
|
|
|
|
|
|
In which year the difference between the total sales and the gross profit is the least?
Study the following graph depicting budget of family.
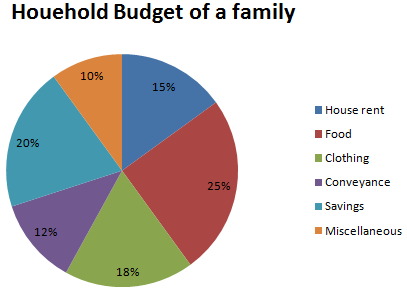
If total monthly income of a family is how much amount is spent on conveyance per month?
The pie chart given below shows the break-up of the cost of construction of a house. Assuming that the total cost of construction is , answer the questions given below.
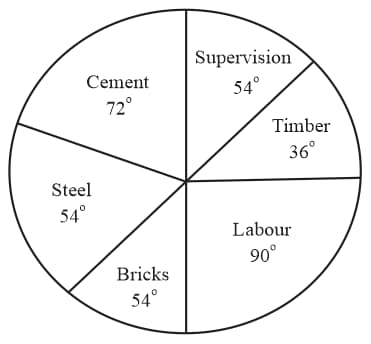
The amount spent on cement, steel and supervision is what per cent of the total cost of construction.
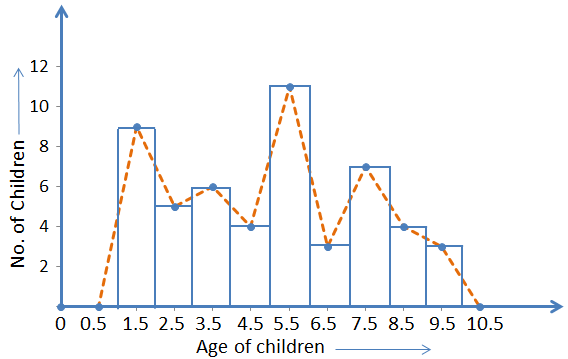
The length of the rectangle of histogram and the frequency are proportional to each other.
Frequency polygon is drawn after drawing the histogram of the collected data.
To draw frequency polygon we need to draw histogram first.
Frequency polygons can also be drawn independently without drawing histograms.
Show the following data by a frequency polygon.
| Electricity bill () | |||||
| Families |
What is the width of each rectangle in the histogram?

What is the area of the first rectangle (from left) of the histogram below?