
Basics of Data Handling
Basics of Data Handling: Overview
This topic covers concepts such as Data Handling, Data in Statistics, Collection of Data, Purpose of Collection of Data, Organisation of Data, Ways for Organisation of Data, Representative Values of Data, and Measures of Central Tendency of Data.
Important Questions on Basics of Data Handling
A _____ of information in numbers is called data. (collection/calculation)
The marks of students in Mathematics (out of ) are as follows:
How many students scored marks or more?
The marks of students in Mathematics (out of ) are as follows:
What is the highest score?The following data shows the different colours of umbrella preferred by a group of people.
| Colour of umbrella | Number of people having umbrellas of that colour |
|---|---|
| Yellow | |
| Red | |
| Green | |
| Blue | |
| Black | |
| Purple |
Observe the given table and answer the following question:
What is the total number of people in the group?
Ganesh buys vegetables and fruits every day. The following data shows expenditure on the same for a week.
| Days | Mon | Tue | Wed | Thur | Fri | Sat | Sun |
|---|---|---|---|---|---|---|---|
| Expenditure |
Observe the given data and answer the following question.
On which day was the expenditure maximum?
The marks of students in Mathematics (out of ) are as follows:
If is the passing mark, how many students failed?
The marks of students in Mathematics (out of ) are as follows:
What is the lowest score?| Colour of umbrella | Number of people having umbrellas of that colour |
|---|---|
| Yellow | |
| Red | |
| Green | |
| Blue | |
| Black | |
| Purple |
The above data shows the different colours of umbrella preferred by a group of people. Find the colour which is the most common.
Statistics is the subject that deals with the collection, presentation, analysis and interpretation of numerical data.
Each numerical figure in a given data is called as observation.
The data shows the weight (in ) of workers in a factory:
.
From the above data, what is the highest observation?
Which of the following is a measure of central tendency?
Given below are the seats won by different political parties in the polling outcome of a state assembly election:
| Political Party | ||||||
| Seats Won |
Name the political party which won the maximum number of seats. ( )
The table below shows the activities that Shyama was involved in on a certain Saturday, from 7:00 AM to 6:00 PM. She spent time watching news, studying, playing computer games, sleeping, on project activities and preparing food.
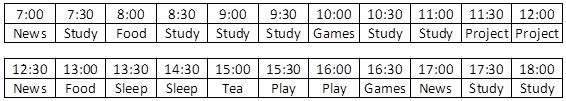
The activity that was the most central to her goal on that day was _____.
(Note: Enter the activity name as exactly given in the table.)
The graph below shows Manu’s weight over a period of 12 months. His doctor advised him to maintain his body weight at around 53 kg to stay healthy.
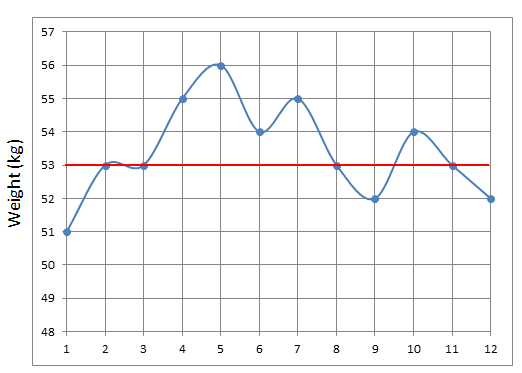
Which of the following is/are good enough reason(s) to consider that Manu is healthy?
(i) Knowing that his body weight was 53 kg on 4 occasions.
(ii) Knowing that his body weight was 53 kg in the first 2 months.
(iii) Knowing that the average body weight across 12 months is 53.4 kg.
(iv) Knowing that the net deviation of his body weight with respect to 53 kg is close to zero.
The table below shows the temperatures measured at different times of the day at a particular location.
Shiva, Urvi and Rajesh noted down the the temperature of the day, based on the information in the table.
| 6:00 | 7:00 | 8:00 | 9:00 | 10:00 | 11:00 | 12:00 | 13:00 | 14:00 | 15:00 | 16:00 | 17:00 |
| 19.5 | 20 |
20.5 |
21 | 21.5 | 22 | 22 | 22 | 22 | 21.5 | 21 | 20.5 |
Shiva: 21$ ℃$, as it is the middle value.
Urvi: 22$ ℃$, as it represents more than 25% of the given data.
Rajesh: 21$ ℃$ as it is the average temperature.
Who represented the temperature of the day correctly?
A teacher wants to focus on the most common type of mistake that children commit while solving math problems. The mistakes committed by 1000 students across all grades are available.
Which of the following information helps the teacher the most?
A farmer wants to get a general idea of the heights of plants on his farm.
He has the following data.
1, 1, 1, 1, 100. All measurements are in feet (ft).
The measure of the central tendency which is NOT a representative of this data distribution is _____.
Ravi appeared for the board examination. In order to pass, he needs to get 35% marks in all the topics put together.
Shown below are his marks (out of 100) in various topics.
12, 12, 15, 20, 22, 30, 65, 66, 70, 75
The central measure of tendency that would help Ravi to decide if he has passed or not is _____.
The measure of central tendency we use to declare the winning candidate in an election is _____.


