
Grouping Data and Histogram
Grouping Data and Histogram: Overview
This topic covers concepts, such as, Grouping Data into Classes, Grouped Frequency Distribution, Difference Between a Histogram and a Bar Graph & Understanding an Histogram etc.
Important Questions on Grouping Data and Histogram
Calculate the mean mark for the data in the table.
| Mark | Frequency |
Write your answer up to two decimal places.
Prepare a frequency distribution by inclusive method taking a class interval of from the following data.
Prepare a frequency distribution by inclusive method taking a class interval of from the following data.
Answer the questions to see the histogram of the heights of students given below.
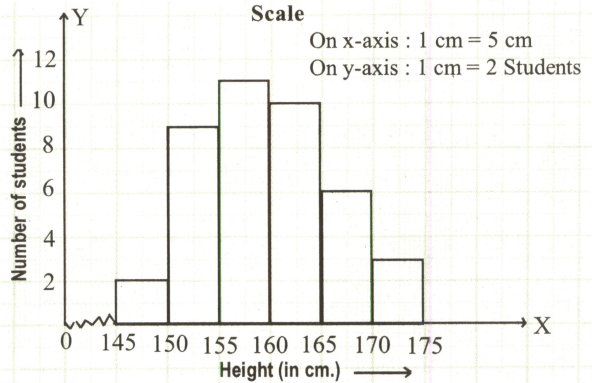
How many students are there with height or more?
Answer the questions to see the histogram of the heights of students given below.
How many students are there with a height less than ?
Answer the questions to see the histogram of the heights of students given below.
What is the number of students of the height
If we want to represent the given data by classes, then how shall we find the interval?
How will you change the given series as continuous series?
The weights of students of a class are
Prepare a frequency distribution table using one class interval as , in which is included and excluded. Which class interval has highest frequency.
The ages (in years) of patients treated in a hospital on a particular day are given below:
| Age (in years) | ||||||
| Number of patients |
Which age group has the highest number of patients.
The following table shows the number of illiterate persons in the age group ( years) in a town. How many illiterates are there in the age group .
| Age group (in years) | ||||||
| Number of illiterate persons |
Class intervals in a grouped frequency are given as . What are the class marks of each class?
Find the size of the class interval:
Find the size of the class interval in the following caes.
Find the size of the class interval.
Use the table given below to find
class boundaries of the class
|
Class |
||||||
|
Frequency |
Use the table given below to find
true class limits of the class.
|
Class |
||||||
|
Frequency |
Use the table given below to find upper and lower limits of
|
Class |
||||||
|
Frequency |
The marks in mathematics of students are as follows :
What is the range?
The range of the data ; is _____.


