
Pictograph
Pictograph: Overview
This topic describes pictograph, the representation of the information through pictures. It can be anything depending on the type of data or information.The pictograph helps solve the problems/questions on the data at a glance.
Important Questions on Pictograph
Given representation of data is called as pie chart.
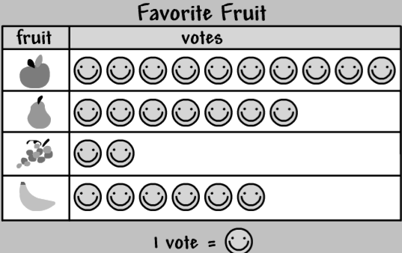
This is one of the simplest ways to represent statistical data.
The following table shows the number of tractors in four different villages.
| Village | Number of tractors |
| Namkir | |
| Dighali | |
| Debera | |
| Jadiya |
Represent the data using a pictograph. Choose a suitable scale.
A book-shelf has books of different subjects. The number of books of each subject is given below:
| Subject | Number of books |
| Telugu | |
| English | |
| Hindi |
Represent the data using a pictograph. Choose a suitable scale.
A book-shelf has books of different subjects. The number of books of each subject is given below:
| Subject | Number of books |
| Telugu | |
| English | |
| Hindi |
Represent the data using a pictograph. Choose a suitable scale.
In a class of , students play various games. The details are shown in the following table.
| Game | Kabaddi | Tennis | Badminton | Cricket |
| Number of students |
Represent the data using a pictograph. Choose a suitable scale.
In a class of , students play various games. The details are shown in the following table.
| Game | Kabaddi | Tennis | Badminton | Cricket |
| Number of students |
Represent the data using a pictograph. Choose a suitable scale.
Tran wrote a tick for each sticker he got. How many stickers did he get?

If represents eggs, then how many eggs does represent ?
| Sports items made by manufactures in a month | |
|---|---|
| Manufacturer |  |
| Manufacturer |  |
| Manufacturer |  |
 represents cricket bats,
  represents hockey sticks and
  represents footballs.
The total number of cricket bats made by manufacturer is _____.
Pictographs can be generally drawn for a single set of data.
Pictograph requires the data to be in whole numbers.
Pictographs are suitable to represent only smaller numbers.
In pictograph, difficult to read and draw partial icons.
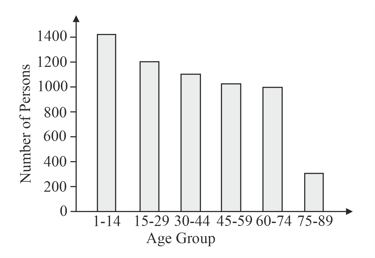
The bar graph given in the following figure represents the various age groups of people in a town. Write the number of people in the youngest age group.
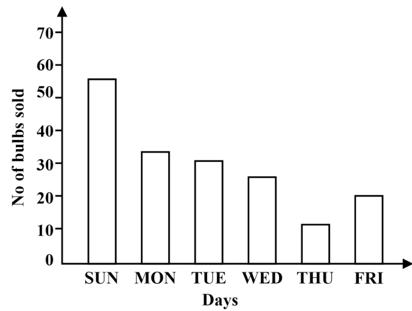
The bar graph given in the following figure represents the number of bulbs sold by a shopkeeper on consecutive days of a week. Study the bar graph and answer the following question.
On which day minimum number of bulbs were sold. (Monday/Tuesday/Wednesday/Thursday/Friday/Saturday/Sunday)
Use the pictograph to answer the following question
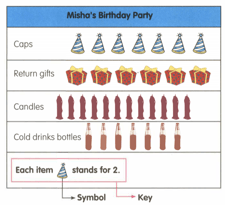
How many more candles does she need than the return gifts?


