
Radar Graphs
Radar Graphs: Overview
This topic covers concepts, such as, Radar Graphs, Structure of Radar Chart, Formation of Table from Radar Chart & Disadvantages of Radar Chart etc.
Important Questions on Radar Graphs
Read the following Radar graph carefully and answer the questions given below. Number of motorvehicles produced by different companies in 3 years (in thousands)
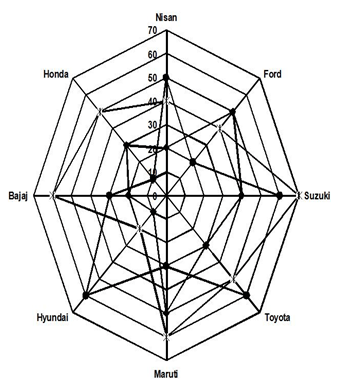
The number of motor vehicles produced by Honda is what percent of that by Maruti?
Read the following graph carefully and answer the question given below.
The graph shows annual income (in Crore) of eight companies in three years 2003, 2004, 2005.
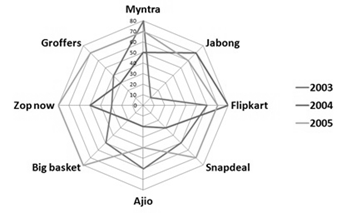
What is the ratio of the total income of flipkart and snapdeal over the given period?
Sale of Books and Notebooks of a Bookshop from year (in ):

From to , in which year there was maximum percentage decrease in the overall sales of both books and notebooks?
Sale of Books and Notebooks of a Bookshop from year (in ):

In which year there was maximum percentage upsurge in the sales for Books?
Sale of Books and Notebooks of a Bookshop from year (in ):

In which year there was maximum percentage upsurge in the sales for Notebooks?
Sale of Books and Notebooks of a Bookshop from year (in ):
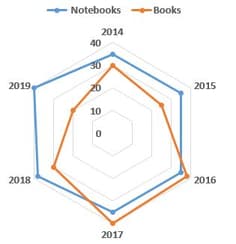
What is the proportion of total number of Books sold to the total number of Notebooks sold in all the years?
Sale of Books and Notebooks of a Bookshop from the year (in ):

In how many years are book sales fewer than notebook sales in the given years?
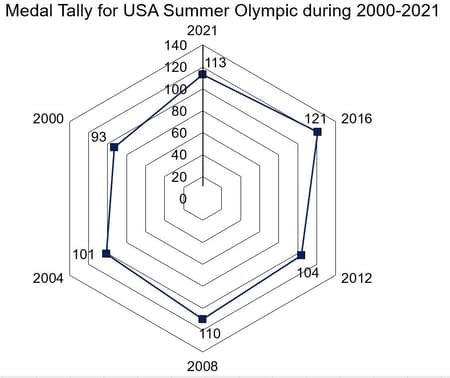
Directions: The following radar graph and table show the medal tally of the USA and China in the Summer Olympics from the period of .

The below table shows the medal tally for China in Summer Olympics during :
| Year | Number of medals |
Convert the data from the table in form of a radar chart and answer the questions below:
In which of the following years, the percentage of medals won by the USA is approx. of the number of medals won by China?Directions: The following radar graph and table show the medal tally of the USA and China in the Summer Olympics from the period of .

The below table shows the medal tally for China in Summer Olympics during :
| Year | Number of medals |
Convert the data from the table in form of a radar chart and answer the questions below:
In which year, the percentage of medals won by the USA is approx. of the number of medals won by China?Directions: The following radar graph and table show the medal tally of the USA and China in the Summer Olympics from the period of .

The below table shows the medal tally for China in Summer Olympics during :
| Year | Number of medals |
Convert the data from the table in form of a radar chart and answer the questions below:
During which year was the percentage increase in medal won was highest for China as compared to the previous year?
Directions: The following radar graph and table show the medal tally of the USA and China in the Summer Olympics from the period of .

The below table shows the medal tally for China in Summer Olympics during :
| Year | Number of medals |
Convert the data from the table in form of a radar chart and answer the questions below:
During which year was the percentage increase in medal won was lowest for China as compared to the previous year?
Directions: The following radar graph and table show the medal tally of the USA and China in the Summer Olympics from the period of .
The below table shows the medal tally for China in Summer Olympics during :
| Year | Number of medals |
Convert the data from the table in form of a radar chart and answer the questions below:
What is the per cent increase in the medal tally of China in the year with respect to the year ?
Study the following radar chart and answer the following question.
The given graph shows the marks of five different students .
Maximum marks
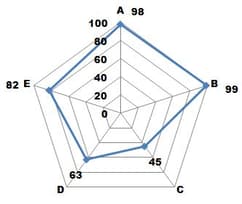
What is the percentage of marks of to that of marks of
Study the following radar chart and answer the following question.
The given graph shows the marks of five different students .
Maximum marks

How much percent of marks of is less than that of marks of
Study the following radar chart and answer the following question.
The given graph shows the marks of five different students .
Maximum marks

Calculate the average of
Study the following radar chart and answer the following question.
The given graph shows the marks of five different students .
Maximum marks

What is the difference between sum of marks of and
Study the following radar chart and answer the following question.
The given graph shows the marks of five different students .
Maximum marks

Calculate the average marks of
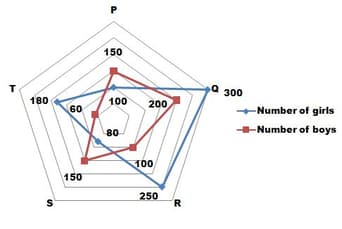
Study the following radar chart and answer the following questions:
The given graph shows the number of girls and boys in different departments

What is the total number of students in departments
Study the following radar chart and answer the following questions:
The given graph shows the number of girls and boys in different departments
What is the average number of boys in all the departments?
Study the following radar chart and answer the following questions:
The given graph shows the number of girls and boys in different departments

Calculate the average number of girls in all departments.


