
Abhishek Chauhan and Vivek Singhal Solutions for Chapter: Data Handling, Exercise 1: Topic Exercise 5.1
Abhishek Chauhan Mathematics Solutions for Exercise - Abhishek Chauhan and Vivek Singhal Solutions for Chapter: Data Handling, Exercise 1: Topic Exercise 5.1
Attempt the practice questions on Chapter 5: Data Handling, Exercise 1: Topic Exercise 5.1 with hints and solutions to strengthen your understanding. All In One MATHEMATICS CBSE Class 8 solutions are prepared by Experienced Embibe Experts.
Questions from Abhishek Chauhan and Vivek Singhal Solutions for Chapter: Data Handling, Exercise 1: Topic Exercise 5.1 with Hints & Solutions
Following numbers related to the weekly wages (in ) of workers in a factory:
Prepare a frequency distribution table. What is the range in wages (in )?
Following numbers related to the weekly wages (in ) of workers in a factory:
Prepare frequency table. How many workers are getting ?
The earnings of shops on a particular day are as follows (the figures have been estimated to the nearest hundreds):
| Earnings (in ) | |||||||
| Number of shops |
Prepare a grouped frequency distribution table taking class interval of equal size, one such interval being .
The marks scored by students in a test are given below:
Complete the following frequency table:
| Marks in class intervals |
Tally marks |
Frequency |
What is the class interval in which the greatest frequency occurs?
Number of workshops organized by a school in different areas during the last five years are as follows:
| Years | Number of workshops |
Draw a histogram representing the above data.
The following histogram shows that the frequency distribution of the age of teachers in a school.
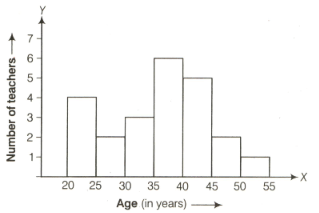
What is the number of eldest and youngest teachers in the school?
The following histogram show that the frequency distribution of the age of teachers in a school.

Which age group teachers are more in the school and which least?
The following histogram show that the frequency distribution of the age of teachers in a school.

What is the size of classes?


