
Abhishek Chauhan and Vivek Singhal Solutions for Chapter: Data Handling, Exercise 2: Topic Exercise 5.2
Abhishek Chauhan Mathematics Solutions for Exercise - Abhishek Chauhan and Vivek Singhal Solutions for Chapter: Data Handling, Exercise 2: Topic Exercise 5.2
Attempt the practice questions on Chapter 5: Data Handling, Exercise 2: Topic Exercise 5.2 with hints and solutions to strengthen your understanding. All In One MATHEMATICS CBSE Class 8 solutions are prepared by Experienced Embibe Experts.
Questions from Abhishek Chauhan and Vivek Singhal Solutions for Chapter: Data Handling, Exercise 2: Topic Exercise 5.2 with Hints & Solutions
The following data represents the different type of animals and their numbers in a zoo. Prepare a pie chart for the given data.
| Animals | Number of animals |
| Deer | |
| Elephants | |
| Giraffe | |
| Reptiles | |
| Tiger |
For the development of basic infrastructure in a district, a project of crore approved by Development Bank is as follows:
| Item head | Road | Electricity | Drinking Water | Sewerage |
| Amount (in crore Rs) |
Draw a pie chart for the above data.
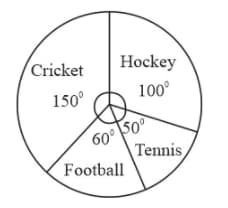
The pie chart (as shown) represents the amount spent on different sports by a sports club in a year. If the total money spent by the club on sports is , then find the amount spent on each sport.
Represent the following data with help of a pie diagram.
| Items | Wheat | Rice | Tea |
| Production(in metric tonnes) |
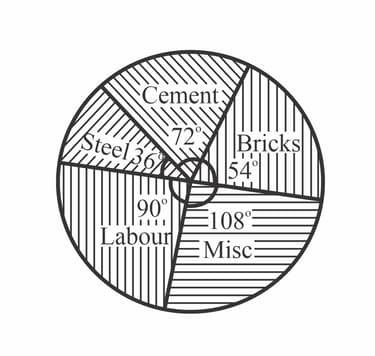
If the pie chart for a construction of a house in a city is given below. Then find the percentage of each item used.
A marketing company conducted a survey among persons in Kanpur:
| Students | Professionals | Government servants | Businessman | Housewife |
Then draw a pie chart and determine the number of persons which are professionals


