Abhishek Chauhan and Vivek Singhal Solutions for Chapter: Introduction to Graphs, Exercise 3: Topic Exercise 15.3
Abhishek Chauhan Mathematics Solutions for Exercise - Abhishek Chauhan and Vivek Singhal Solutions for Chapter: Introduction to Graphs, Exercise 3: Topic Exercise 15.3
Attempt the practice questions on Chapter 15: Introduction to Graphs, Exercise 3: Topic Exercise 15.3 with hints and solutions to strengthen your understanding. All In One MATHEMATICS CBSE Class 8 solutions are prepared by Experienced Embibe Experts.
Questions from Abhishek Chauhan and Vivek Singhal Solutions for Chapter: Introduction to Graphs, Exercise 3: Topic Exercise 15.3 with Hints & Solutions
The following table gives the growth chart of a child.
| Height(in cm) | |||||
| Age(in yr) |
Draw a line graph for the table and find the two consecutive periods when the child grow more faster.
The graph given below shows the temperatures recorded on a day at different times.
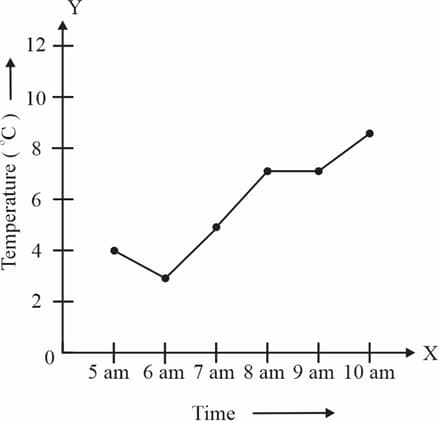
If the temperature at is , then find the value of .
The graph given below shows the temperatures recorded on a day at different times:
Observe the graph and answer the following question.
At what time is the temperature ?
The graph given below shows the temperatures recorded on a day at different times.
During which hour did the temperature fall?
The following table gives the body temperature in corresponding to . Draw the graph using the table.
| Temperature() | |||
| Temperature() |
What will be the temperature in , when it is ?
The following table gives the body temperature in corresponding to . Draw the graph using the table.
| Temperature() | |||
| Temperature() |
What will be the temperature in , when it is ?
Draw a 'deposit graph' for the following data and from the graph, find the interest on for year.
| Deposit(in ) | |||||
| Simple interest(in ) in year |
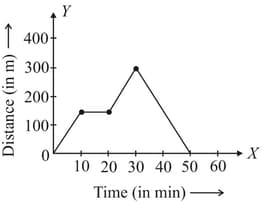
In the given figure shows that, the movement of an object across a playground. How long the object was stationary?