
Reading of Pie Diagram
Important Questions on Reading of Pie Diagram
The time required for students to do a science experiment and the number of students is shown in the following grouped frequency distribution table. Show the information by a histogram and also by a frequency polygon.
| Time required for experiment (minutes) |
||||||
| Number of students |
Draw a frequency polygon for the following grouped frequency distribution table.
| Age of the donor (Years) |
||||||
| Number of blood donors |
Medical checkup of women was conducted in a health centre in a village. of them were short of haemoglobin, suffered from cataract and had respiratory disorders. The remaining women were healthy. Show the information by a pie diagram.
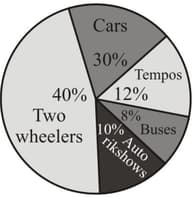
The given pie diagram shows the percentages of number of vehicles passing a signal in a town between and . If the number of two-wheelers is , then find the number of all vehicles.
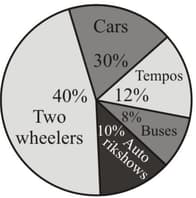
The given pie diagram shows the percentages of number of vehicles passing a signal in a town between and . Find the central angle for each type of vehicle.
A survey of students was made to know which game they like. The data obtained in the survey is presented in the given pie diagram.
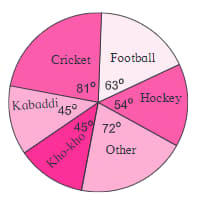
If the total number of students is , then how many students prefer other games?
A survey of students was made to know which game they like. The data obtained in the survey is presented in the given pie diagram.
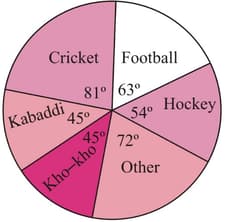
If the total number of students is , then how many students like football?
On an environment day, students in a school planted trees under plantation project, which is shown in the following table. Show it by a pie diagram.
| Tree name | Karanj | Behada | Arjun | Bakul | Kadunimb |
| Number of trees |
The following table shows the causes of noise pollution. Show the information by a pie diagram.
| Causes | Construction | Traffic | Aircraft take offs | Industry | Trains |
| Percentage of contribution |
The annual investments of a family are shown in the given pie diagram.
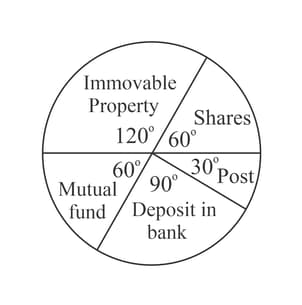
If the investment in shares is , then the total investment is . Find the value of .
The pie diagram in the given figure shows the proportions of different workers in a town.
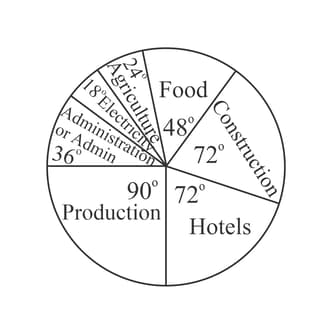
If the total workers is , what is the percentage of workers in the field of production?
The pie diagram in the given figure shows the proportions of different workers in a town.
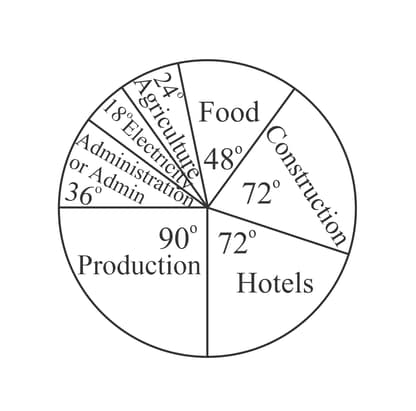
If the total workers is , then how many of them are working in the field of administration/admin?
The pie diagram in the given figure shows the proportions of different workers in a town.

If the total workers is , then how many of them are working in the field of construction?
The following table shows the percentage of demands for different fruits registered with a fruit vendor. Show the information by a pie diagram.
| Fruits | Mango | Sweet lime | Apples | Cheeku | Oranges |
| Percentages of demand |
In a tree plantation programme, the number of trees planted by students of different classes is given in the following table. Draw a pie diagram showing the information.
| Standard | th | th | th | th | th | th |
| Number of trees |
The marks obtained by a student in different subjects are shown. Draw a pie diagram showing the information.
| Subject | English | Marathi | Science | Mathematics | Social science | Hindi |
| Marks |


