
Circle Graph or Pie Chart
Important Questions on Circle Graph or Pie Chart
The pie-chart shows the number of students who voted for different colours as their favourite colour.

If students voted in all, then how many did vote 'others' as their favourite?
"Note: This question given in the book seems to have errors and the modified question should be as given below."
Look at table and answer the following question.
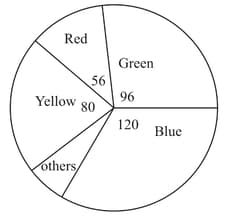
If students voted in all, which colour received of the votes?
"Note: This question given in the book seems to have errors and the modified question should be as given below."
Look at the table and answer the following question.
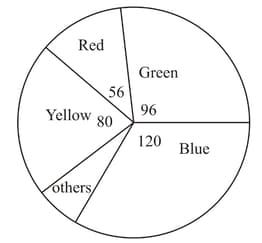
If students voted in all, which of the following is a reasonable conclusion for the given data?
The following pie chart represents the proposed outlay of the fifth five-year plan of . Examine the following pie chart and answer the question that follows.
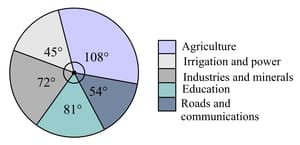
How much amount (in crore) proposed on irrigation and power is less than that on industries and minerals?
The following pie chart represents the proposed outlay of the year plan of . Examine the following pie chart and answer the question that follows.
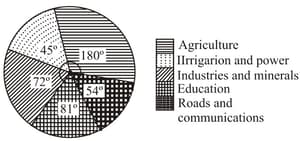
How much amount proposed on agriculture is more than that on industries and minerals in measure?
In the adjacent pie chart, percentage expenses on various items during the production of a book are given. Based upon the information given in the pie chart, answer the question given below.
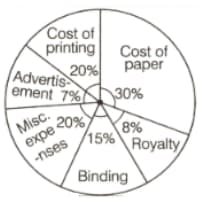
Find the central angle corresponding to the cost of printing.
In the adjacent pie chart, percentage expenses on various items during the production of a book are given. Based upon the information given in the pie chart, answer the question given below.
If the cost of paper is , then the expenses on Advertisement is , find the value of
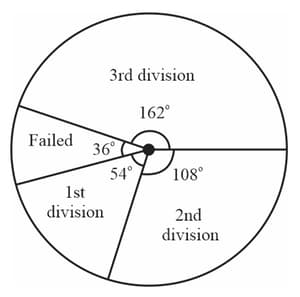
The following pie chart shows the analysis of the result of an examination in which the number of candidates who failed is five.
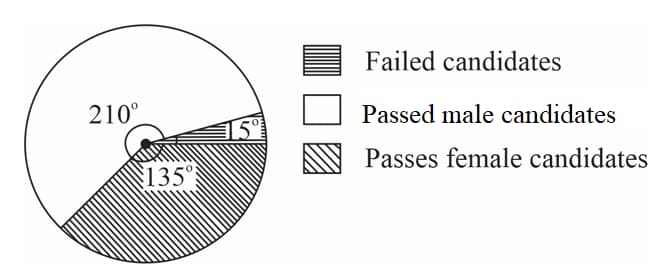
Find the percentage of passed female candidates with respect to the total examinees.
The following pie chart shows the analysis of result of an examination in which the number of candidates failed is five. Study the pie chart and answer the question given below.
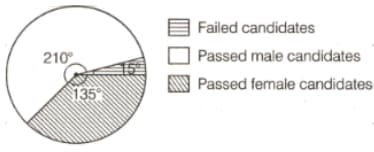
Find the total number of examinees.
The following pie chart shows that the performance of an examination in a particular year for students.
Find the number of students who passed with nd division more than those with st division.
The following pie chart shows that the performance in an examination in a particular year for students.
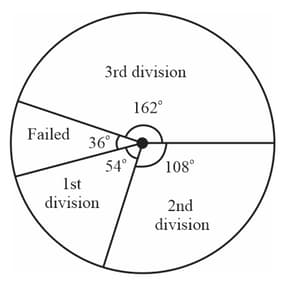
Find the number of students who passed with division.
The given pie chart shows the annual agricultural field of a certain place.
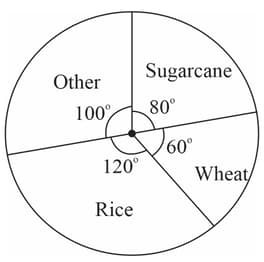
Find the ratio of field of rice and wheat to sugarcane and others.
The given pie chart show that the annual agricultural field of a certain place.
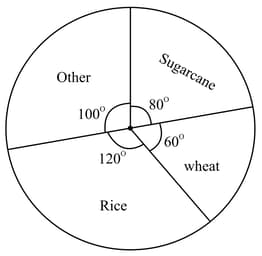
The field of rice is how much percent more than that of sugarcane? (Write your final answer in decimals without units)
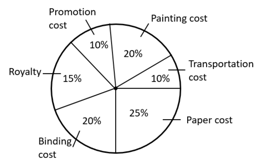
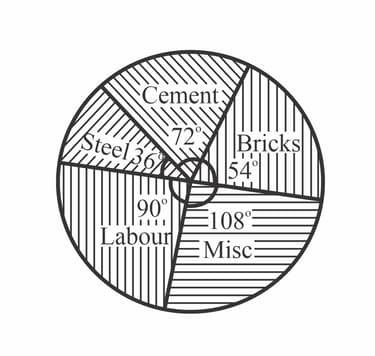
If the pie chart for a construction of a house in a city is given below. Then find the percentage of each item used.
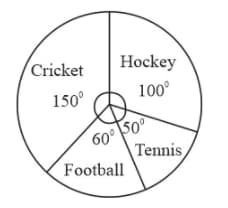
The pie chart (as shown) represents the amount spent on different sports by a sports club in a year. If the total money spent by the club on sports is , then find the amount spent on each sport.
A marketing company conducted a survey among persons in Kanpur:
| Students | Professionals | Government servants | Businessman | Housewife |
Then draw a pie chart and determine the number of persons which are professionals
Represent the following data with help of a pie diagram.
| Items | Wheat | Rice | Tea |
| Production(in metric tonnes) |
For the development of basic infrastructure in a district, a project of crore approved by Development Bank is as follows:
| Item head | Road | Electricity | Drinking Water | Sewerage |
| Amount (in crore Rs) |
Draw a pie chart for the above data.
The following data represents the different type of animals and their numbers in a zoo. Prepare a pie chart for the given data.
| Animals | Number of animals |
| Deer | |
| Elephants | |
| Giraffe | |
| Reptiles | |
| Tiger |


