
Andhra Pradesh Board Solutions for Chapter: Data Handling, Exercise 4: Do This
Andhra Pradesh Board Mathematics Solutions for Exercise - Andhra Pradesh Board Solutions for Chapter: Data Handling, Exercise 4: Do This
Attempt the practice questions on Chapter 7: Data Handling, Exercise 4: Do This with hints and solutions to strengthen your understanding. Mathematics 7 solutions are prepared by Experienced Embibe Experts.
Questions from Andhra Pradesh Board Solutions for Chapter: Data Handling, Exercise 4: Do This with Hints & Solutions
In a unit test Amar secured marks in Telugu, Hindi, English, Mathematics, Science and Social Science respectively. Peter got marks in the above subjects respectively. Interpret the data in an organised manner.
Draw a pie chart for the following data.
| Item of expenditure | Food | Health | Clothing | Education | Savings |
| Amount spent in rupees |
Draw a double bar graph for the following data. Birth and Death rates of different states in .
| State | Birth Rate (Per ) | Death Rate (Per ) |
| Andhra Pradesh | ||
| Karnataka | ||
| Tamil Nadu | ||
| Kerala | ||
| Maharashtra | ||
| Orissa |
Source: The table is taken from vital statistics SRS .
Draw a Pie chart for the following data. Time spent by a child during a day:
| Time spent for | Sleep | School | Play | Others |
| Time spent | hours | hours | hours | hours |
The adjoining pie chart gives the expenditure on various items during a month for a family. (The numbers written around the pie chart tell us the angles made by each sector at the centre.)

Answer the following: On which item is the expenditure minimum?
The adjoining pie chart gives the expenditure on various items during a month for a family. (The numbers written in the pie chart tell us the angles made by each sector at the centre.)
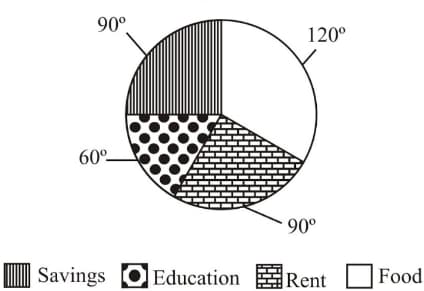
Answer the following: On which item is the expenditure maximum?
The adjoining pie chart gives the expenditure on various items during a month for a family. (The numbers written in the pie chart tell us the angles made by each sector at the centre.)

Answer the following: If the monthly income of the family is , what is the expenditure on rent?
The adjoining pie chart gives the expenditure on various items during a month for a family. (The numbers written around the pie chart tell us the angles made by each sector at the centre.)
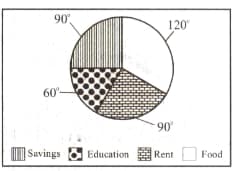
Answer the following: If the expenditure on food is , what is the expenditure on education of children?


