
Embibe Experts Solutions for Chapter: Quantitative Aptitude Practice Book, Exercise 1: Exercise 1
Embibe Experts Quantitative Aptitude Solutions for Exercise - Embibe Experts Solutions for Chapter: Quantitative Aptitude Practice Book, Exercise 1: Exercise 1
Attempt the free practice questions on Chapter 1: Quantitative Aptitude Practice Book, Exercise 1: Exercise 1 with hints and solutions to strengthen your understanding. Quantitative Aptitude Practice Book for IBPS RRB PO 2023 (500+ Questions) solutions are prepared by Experienced Embibe Experts.
Questions from Embibe Experts Solutions for Chapter: Quantitative Aptitude Practice Book, Exercise 1: Exercise 1 with Hints & Solutions
What should come in place of the question mark (?) in the following question?
These questions are based on the following data. Study it carefully and answer the questions that follow:
In a school that has students, boys and girls are in the ratio of respectively. The students speak Hindi, English, or both languages, of the boys speak only Hindi, of the girls speak only English. of the total students speak only Hindi and the no. of boys speaking both languages is six times the number of boys speaking only Hindi.
Total how many students speak English?
Study the following information carefully and answer the questions that follow:
A company produces four different products, viz., Mobile phones, Televisions, Refrigerators, and Computers. Each of the products has two categories, viz., category- and category-. The total number of all the products is . Twenty-five per cent of the total number of products is Computers and one-third of the total number of products is Televisions. Thirty-two per cent of the total products are Refrigerators. Fifty per cent of each of the total number of Televisions as well as the total number of refrigerators is of category-. Forty per cent of the total number of Computers is of category-. One-third of the total number of mobile phones is of category-.
What is the respective ratio between the number of televisions of Category and the number of computers of Category ?
Number of students (in thousands) in two different universities in six different years:
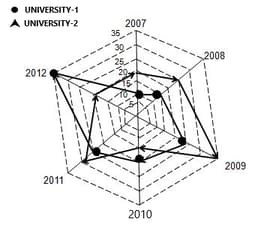
What was the difference between the number of students in university- in the year and the number of students in university- in the year ?
Study the following table carefully to answer these questions:
The number of flights (in hundreds) cancelled in five different states during six different years are as following:
| State | |||||
| Year | Punjab | Haryana | Rajasthan | Assam | West Bengal |
What was the respective ratio between the number of flights cancelled in Rajasthan in the year and number of flights cancelled in West Bengal in the year ?
Study the table carefully to answer the question that follows:
The number of candidates who appeared and qualified a test (in hundreds) in six different years from five different zones,
| Year | Zone | |||||||||
| P | Q | R | S | T | ||||||
| App. | Qual. | App. | Qual. | App. | Qual. | App. | Qual. | App. | Qual. | |
| App :- Appeared | Qual:- Qualified | |||||||||
In which years was in Zone-S the difference between the appeared candidates and qualified candidates second lowest?
Study the following table carefully to answer the questions that follow:
The amount earned ( in lacs) by five persons in six different years
| YEAR | PERSON | ||||
| A | B | C | D | E | |
What is the approximate per cent increase in the amount earned by Person-D in the year as compared to the previous year?
Study the following graph carefully to answer the question.
The graph shows the Percent Profit earned by two companies over different months.
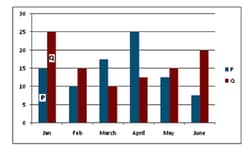
If each of the companies P and Q invested in June, what was the average profit earned by the two companies in that month


