
Asit Das Gupta and Alok Kumar Solutions for Exercise 2: EXERCISE 1B
Asit Das Gupta Mathematics Solutions for Exercise - Asit Das Gupta and Alok Kumar Solutions for Exercise 2: EXERCISE 1B
Attempt the free practice questions from Exercise 2: EXERCISE 1B with hints and solutions to strengthen your understanding. Essential ICSE Mathematics for Class 6 solutions are prepared by Experienced Embibe Experts.
Questions from Asit Das Gupta and Alok Kumar Solutions for Exercise 2: EXERCISE 1B with Hints & Solutions
The following table shows the amount of money spent by four friends on soft drinks in a day. Use the key given alongside to represent the data by a pictograph.
| Name | Amit | Ajoy | Amol | Ajit |
| Amount |

The Following table shows the number of students absent on five consecutive days.
| Day | Monday | Tuesday | Wednesday | Thursday | Friday |
| Number of students |
Represent the data by a pictograph. Use the key(scale) given alongside.  students
The following column graph shows the runs scored by India during a cricket match. The scale used is . At the beginning of the th over, India needed runs per over for the remaining over to win the match.
How many runs did India score in the th over?
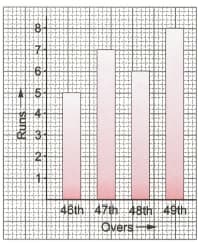
The following column graph shows the runs scored by India during a cricket match. The scale used is . At the beginning of the th over, India needed runs per over for the remaining over to win the match.
How many runs did India require to make in the th over to win in the match?
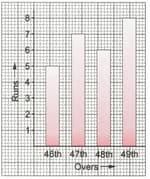
The following column graph shows the runs scored by India during a cricket match. The scale used is . At the beginning of the th over, India needed runs per over for the remaining over to win the match.
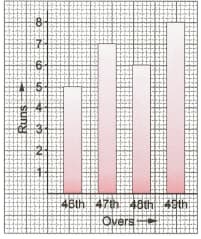
Represent the data in tabular form.
The table shows the time taken by four students to read a story. Represent the data by a bar graph.
| Name | Ruby | Nitin | Beeru | Bonny |
| Time taken (in min) |
The table shows the number of wickets taken by a bowler in five matches. Use a column graph to represent the data.
| Match | I | II | III | IV | V |
| Number of wickets |
On a popularity rating conducted by Sun Network, actress A received votes, actress B received votes, actress C received votes, and others receive votes. Display the data using a column graph.


