Embibe Experts Solutions for Chapter: Kinetic Theory of Gases, Exercise 2: Exercise-2
Embibe Experts Physics Solutions for Exercise - Embibe Experts Solutions for Chapter: Kinetic Theory of Gases, Exercise 2: Exercise-2
Attempt the practice questions on Chapter 18: Kinetic Theory of Gases, Exercise 2: Exercise-2 with hints and solutions to strengthen your understanding. Beta Question Bank for Engineering: Physics solutions are prepared by Experienced Embibe Experts.
Questions from Embibe Experts Solutions for Chapter: Kinetic Theory of Gases, Exercise 2: Exercise-2 with Hints & Solutions
Three closed vessels and are at the same temperature and contain gases which obey the Maxwellian's distribution of velocities. Vessel contains only only and a mixture of equal quantities of and . If the average speed of the molecules in vessel is that of the molecules in vessel is , the average speed of the molecules in vessel is (where is the mass of an oxygen molecule)
When a gas is heated in a vessel of constant volume, the pressure increases because
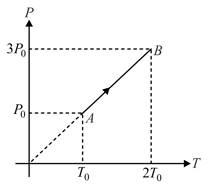
Pressure versus temperature graph of an ideal gas is shown in figure. Density of the gas at point is . Density at will be:-
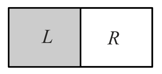
A vessel is partitioned in two equal halves by a fixed diathermic separator. Two different ideal gases are filled in left and right halves. The root-mean-square speed of the molecules in part is equal to the mean speed of molecules in the part. Then the ratio of the mass of a molecule in part to that of a molecule in part is:-
A closed vessel contains a mixture of two diatomic gases and . Molar mass of is times that of and mass of gas contained in the vessel is times that of . Choose the correct statement().
Let , and respectively denote the mean speed, root-mean-square speed and most probable speed of the molecules in an ideal mono atomic gas at absolute temperature . The mass of a molecule is . Then,
The pressure of one mole of an ideal gas varies according to the law , where and a are positive constants. The highest temperature that the gas may attain is:-
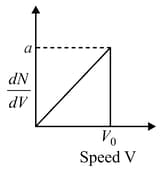
Graph shows a hypothetical speed distribution for a sample of gas particle:( for )