
Histograms
Important Questions on Histograms
Draw a histogram to represent the following grouped frequency distribution:
| Age (in years) | |||||||
| Number of teachers |
surnames were randomly picked up from a local telephone directory and a frequency distribution of the number of letters in the English alphabet in the surnames was found as follows:
| Number of letters | |||||
| Number of surnames |
Draw a histogram to depict the given information. Write the class interval in which the maximum number of surnames lie.
surnames were randomly picked up from a local telephone directory and a frequency distribution of the number of letters in the English alphabet in the surnames was found as follows:
| Number of letters | |||||
| Number of surnames |
Draw a histogram to depict the given information.
Draw a histogram to represent the following data:
| Marks obtained | ||||||
| Number of students |
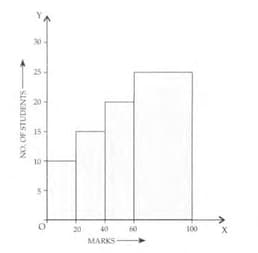
The frequency distribution has been represented graphically (shown in the adjoining figure). Do you think this representation is correct? Why?
| Marks | Number of students |
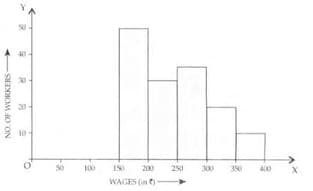
In the adjoining figure, there is a histogram depicting daily wages of workers in a factory. Construct the frequency distribution table.
The frequency is the frequency distribution of total marks obtained by the students of different sections of class VIII
| Marks | |||||
| Number of students |
Draw histogram for the above distribution
Draw a histogram and frequency polygon for the following data
| Class marks | ||||||
| Frequency |


