
Types of Data
Important Questions on Types of Data
A histogram is drawn with three columns whose widths are in the ratio . The frequency densities of these classes are in the ratio , respectively.
Given that the total frequency of the data is , find the frequency of each class.
The classes with the two highest frequencies are to be merged and a new histogram drawn. Given that the height of the column representing the merged classes is to be , find the correct height for the remaining column.Explain what problems you would encounter if asked to construct a histogram in which the classes with the two lowest frequencies are to be merged.
A histogram is drawn with three columns whose widths are in the ratio . The frequency densities of these classes are in the ratio , respectively.
Given that the total frequency of the data is , find the frequency of each class.
The classes with the two highest frequencies are to be merged and a new histogram drawn. Given that the height of the column representing the merged classes is to be , find the correct height for the remaining column.University students measured the heights of the trees in the grounds of a primary school. As part of a talk on conservation at a school assembly, the students have decided to present their data using one of the following diagrams.
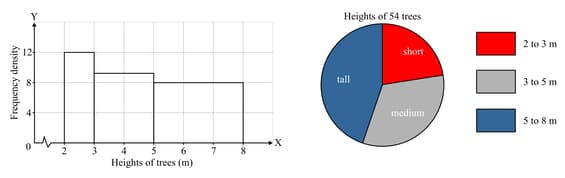
Give one disadvantage of using each of the representations shown.
Boxes of floor tiles are to be offered for sale at a special price of The boxes claim to contain at least tiles each.
Why would it be preferable to use a stem-and-leaf diagram rather than a bar chart to represent the numbers of tiles, which are and
A large number of chickens' eggs are individually weighed. The masses are grouped into nine classes, each of width grams, from to .
Name a type of representation in which the fact could be seen that the majority of the eggs have masses from to Explain how the representation would show this.
Jamila noted each student's answer when her year group was asked to name their favourite colour.
List the methods of representation that would be suitable for displaying Jamila's data.
Jamila wishes to emphasise that the favourite colour of exactly three-quarters of the students is blue. Which type of representation from your list do you think would be the most effective for Jamila to use? Explain why you have chosen this particular type of representation.
Jamila noted each student's answer when her year group was asked to name their favourite colour.
List the methods of representation that would be suitable for displaying Jamila's data.


