
Dean Chalmers and Julian Gilbey Solutions for Chapter: Representation of Data, Exercise 4: EXERCISE 1B
Dean Chalmers Mathematics Solutions for Exercise - Dean Chalmers and Julian Gilbey Solutions for Chapter: Representation of Data, Exercise 4: EXERCISE 1B
Attempt the practice questions on Chapter 1: Representation of Data, Exercise 4: EXERCISE 1B with hints and solutions to strengthen your understanding. Cambridge International AS & A Level Mathematics : Probability & Statistics 1 Course Book solutions are prepared by Experienced Embibe Experts.
Questions from Dean Chalmers and Julian Gilbey Solutions for Chapter: Representation of Data, Exercise 4: EXERCISE 1B with Hints & Solutions
The table below shows the heights, in metres, of boys and of girls.
| Height | ||||
| No. boys | ||||
| No. girls |
The heights of saplings are shown in the following table.
| Height | ||||
| No. saplings |
less than
The heights of saplings are shown in the following table.
| Height | ||||
| No. saplings |
between and
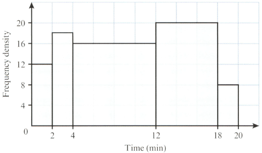
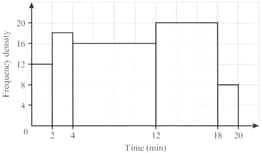
Each of the trainees at a secretarial college was asked to type a copy of a particular document. The times taken are shown, correct to the nearest minutes, in the following table.
| Time taken (min) | ||||
| No. trainees |
A railway line monitored of its August train journeys to find their departure delay times. The results are shown below. It is given that of these journeys were delayed by less than minutes.
How many journeys were monitored?
A railway line monitored of its August train journeys to find their departure delay times. The results are shown below. It is given that of these journeys were delayed by less than minutes.
Calculate an estimate of the number of these journeys that were delayed by:
to minutes
A university investigated how much space on its computers' hard drives is used for data storage. The results are shown below. It is given that hard drives use less than for data storage.
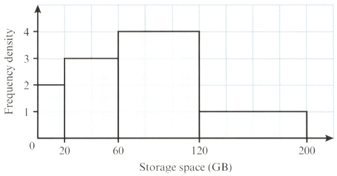
Find the total number of hard drives represented.
A university investigated how much space on its computers' hard drives is used for data storage. The results are shown below. It is given that hard drives use less than for data storage.

Calculate an estimate of the number of hard drives that use less than


