
Sue Pemberton, Julianne Hughes and, Julian Gilbey Solutions for Chapter: Numerical Solutions of Equations, Exercise 4: EXERCISE 6C
Sue Pemberton Mathematics Solutions for Exercise - Sue Pemberton, Julianne Hughes and, Julian Gilbey Solutions for Chapter: Numerical Solutions of Equations, Exercise 4: EXERCISE 6C
Attempt the free practice questions on Chapter 6: Numerical Solutions of Equations, Exercise 4: EXERCISE 6C with hints and solutions to strengthen your understanding. Cambridge International AS & A Level Mathematics : Pure Mathematics 2 & 3 Course Book solutions are prepared by Experienced Embibe Experts.
Questions from Sue Pemberton, Julianne Hughes and, Julian Gilbey Solutions for Chapter: Numerical Solutions of Equations, Exercise 4: EXERCISE 6C with Hints & Solutions
Use an iterative process based on the equation to find the value of correct to decimal places. Given that the value of lies between . Show the result of each iteration to decimal places.
The parametric equations of a curve are . The curve has a stationary point for a value of .
Hence find the coordinates of the stationary point, giving each coordinate correct to significant figure.
In the diagram, triangle is right-angled and angle is radians. The point is the mid point of and . Angle is radians and is a sector of the circle with centre The area of triangle is times the area of the shaded segment.
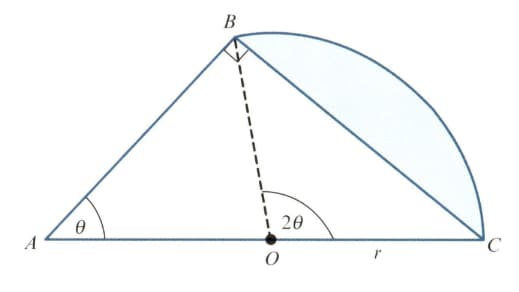
Show that satisfies the equation .
In the diagram, triangle is right-angled and angle is radians. The point is the mid point of and . Angle is radians and is a sector of the circle with centre The area of triangle is times the area of the shaded segment.

This equation has one root in the interval . Use the iterative formula to determine the root correct to decimal places. Give the result of each iteration to decimal places.
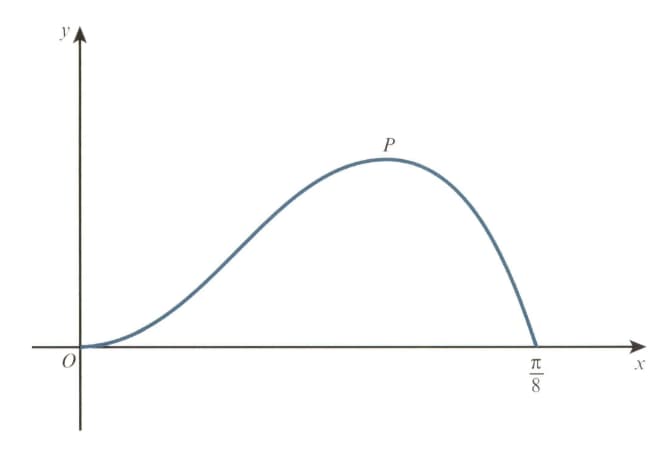
The diagram shows the curve for The point is a maximum point.
Show that the -coordinate of satisfies the equation .

The diagram shows the curve for The point is a maximum point.
Show also that the -coordinate of satisfies the equation .
The diagram shows the curve for The point is a maximum point.
Using an iterative formula based on the equation with initial value . Find the -coordinate of correct to decimal places. Give the result of each iteration to decimal places.
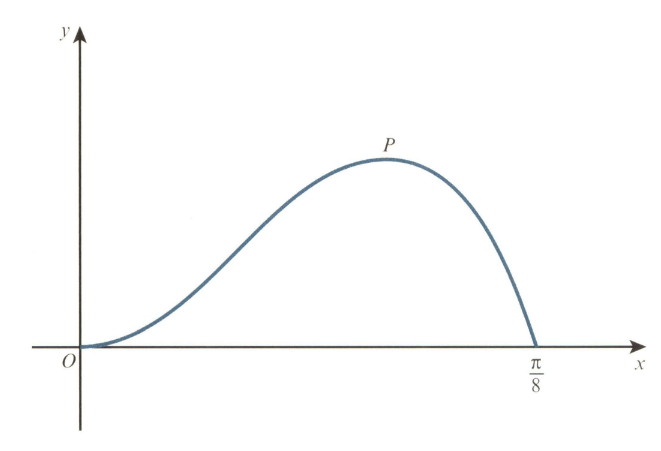
The diagram shows the curve for The point is a maximum point.
Use integration by parts twice to find the exact area enclosed between the curve and the -axis from to .


