
Lynn Byrd, Greg Byrd and, Chris Pearce Solutions for Chapter: Interpreting Results, Exercise 3: Exercise 16.2
Lynn Byrd Mathematics Solutions for Exercise - Lynn Byrd, Greg Byrd and, Chris Pearce Solutions for Chapter: Interpreting Results, Exercise 3: Exercise 16.2
Attempt the practice questions on Chapter 16: Interpreting Results, Exercise 3: Exercise 16.2 with hints and solutions to strengthen your understanding. Cambridge Lower Secondary Mathematics Learner's Book 7 Second Edition Digital Access solutions are prepared by Experienced Embibe Experts.
Questions from Lynn Byrd, Greg Byrd and, Chris Pearce Solutions for Chapter: Interpreting Results, Exercise 3: Exercise 16.2 with Hints & Solutions
Chinara and Aduka compare their scores from five mental maths tests. The compound bar charts shows their test scores.
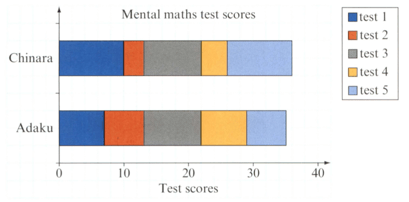
In which test did Chinara and Aduka get the same score?
Chinara and Adaku compare their scores from five mental maths tests. The compound bar chart shows their test scores.

In each test there was a total possible score of . Write Adaku's total score for the five tests as a percentage.
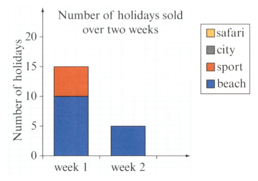
This two-way table shows the number of holidays sold by a travel agency in a period of two weeks.
| Type of holidays | ||||
| beach | sport | city | safari | |
| Week | ||||
| Week | ||||
Copy the compound bar chart shown and use the information in the two-way table to complete the chart.
The compound bar chart shows the number of football matches won, lost and drawn by three teams.
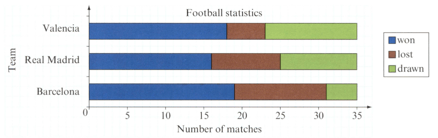
Copy this two-way table and use the information in the chart to complete the table.
| Won | Lost | Drawn | Total | |
| Barcelona | ||||
| Real Madrid | ||||
| Valencia | ||||
| Total |
Chinara and Adaku compare their scores from five mental maths tests. The compound bar chart shows their test scores.
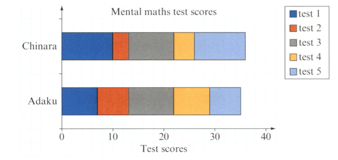
In each test there was a total possible score of . Write Adaku's total score for the five tests as a fraction.
This two-way table shows the number of cakes sold by a cafe on Saturday and Sunday.
| Chocolate | Vanilla | |
| Saturday | ||
| Sunday |
Draw a compound bar chart to show this information.
This two-way table shows the number of cakes sold by a cafe one Saturday and Sunday.
| Chocolate | Vanilla | |
| Saturday | ||
| Sunday |
Draw a compound bar chart to show this information. Make one comment on what your chart shows.
This two-way table shows the number of cakes sold by a cafe one Saturday and Sunday.
| Chocolate | Vanilla | |
| Saturday | ||
| Sunday |
Which chart do you think is the best to use to dispaly this information. Give reasons for your answer.


