
Graphical Representation of Linear Motion
Important Questions on Graphical Representation of Linear Motion
A ball moves on a smooth floor in a straight line with a uniform velocity for . At , the ball hits a ball and come back along the same line to the starting point with same speed. Draw the velocity-time graph and use it to find the total distance travelled by the ball and its displacement.
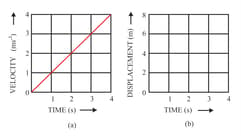
The figure shows velocity-time graph for the motion of a body. Use it to find the displacement of the body at and , then draw displacement-time graph for it on figure (b).
A body is at rest is made to fall from the top of a tower. Its displacement at different instants is given in the following table
| Time (in ) | ||||||
| Displacement (in ) |
Draw a displacement-time graph and state whether the motion is uniform or non-uniform?
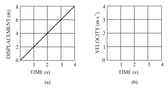
Figure shows the displacement of a body at different times
Calculate the average velocity during the time interval to .
For the uniform motion :
For a uniformly retarded motion, the velocity-time graph is :
The velocity-time graph of a body in motion is a straight line inclined to the time axis. The correct statement is :
A body falls freely from a certain height. Show graphically the relation between the distance fallen and the square of time. How will you determine from this graph?
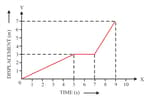
Figure (a) shows the displacement-time graph for the motion of a body. Use it to calculate the velocity of a body and , then draw the velocity-time graph for it in figure (b).
How is the distance related to time for the motion under uniform acceleration such as the motion of a freely falling body?
Draw a velocity-time graph for the free fall of a body under gravity, starting from rest .
Draw a graph for acceleration against time for a uniformly accelerated motion. How can it be used to find the change in speed in a certain interval of time?
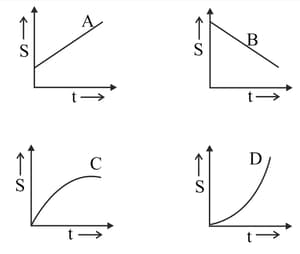
The figure shows the displacement-time graph for four bodies A, B, C, and D. In each case state what information you get about the acceleration (zero, positive or negative).
The velocity-time graph for a uniformly retarded body is a straight line inclined to the time axis with an obtuse angle. How is retardation calculated from the velocity-time graph?
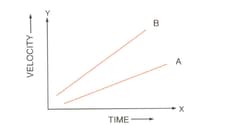
The figure shows the velocity-time graph for two cars A and B moving in the same direction. Which car has the greater acceleration? Give reason to your answer.
Draw a velocity-time graph for a body moving with an initial velocity and uniform acceleration . Use this graph to find the distance travelled by the body in time .
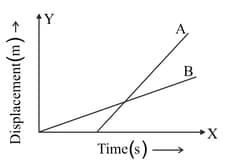
The figure shows a displacement-time graph of two vehicles A and B moving along a straight road. Which vehicle is moving faster? Give reason.
What does the slope of the velocity-time graph represent?
Draw a displacement-time graph for a boy going to school with a uniform velocity.
Can the displacement-time sketch be parallel to the displacement axis? Give a reason for your answer.


