
Embibe Experts Solutions for Chapter: Data Interpretation, Exercise 1: Exercise 1
Embibe Experts Quantitative Aptitude Solutions for Exercise - Embibe Experts Solutions for Chapter: Data Interpretation, Exercise 1: Exercise 1
Attempt the free practice questions on Chapter 3: Data Interpretation, Exercise 1: Exercise 1 with hints and solutions to strengthen your understanding. Embibe Quantitative Aptitude solutions are prepared by Experienced Embibe Experts.
Questions from Embibe Experts Solutions for Chapter: Data Interpretation, Exercise 1: Exercise 1 with Hints & Solutions
The given histogram shows the height of the students.
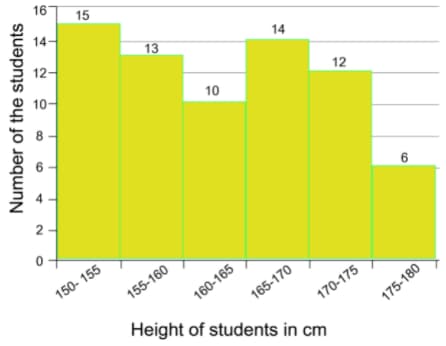
The number of students whose height is in the class interval is what percent less than the number of students whose height is in interval ? (correct to one decimal place)
The following histogram shows the weights of students of class in a school on a particular day. Total number of students enrolled in class .
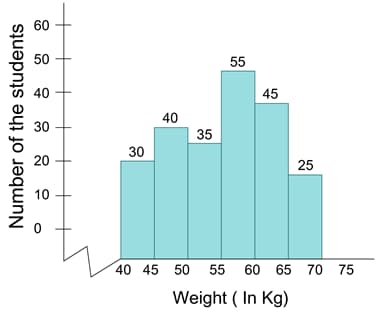
The number of students weighing less than is what percent more than the number of students weighing?
The given histogram shows the frequency distribution of the speed of cars passing through a particular spot on a highway. Read the graph and answer the following question.

What is the ratio of the number of cars with speed less than to the number of cars with speed more than ?
The given histogram shows the frequency distribution of the speed of cars passing through a particular spot on a highway. Read the graph and answer the following question.
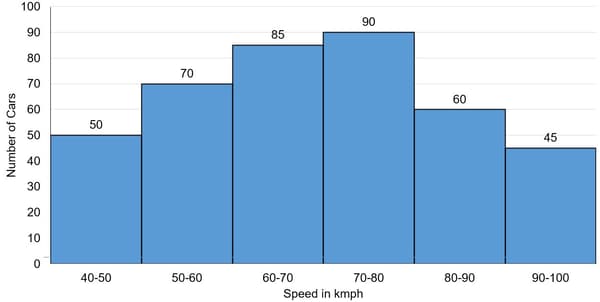
What percentage of cars were running with the speed of and above?
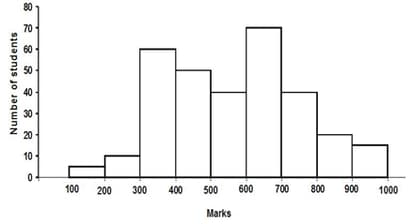
Adjoining figure is the Histogram of marks obtained in a examination. Total marks is and pass marks is The ratio of the number of students securing marks to is -
The given histogram shows the height of the students.
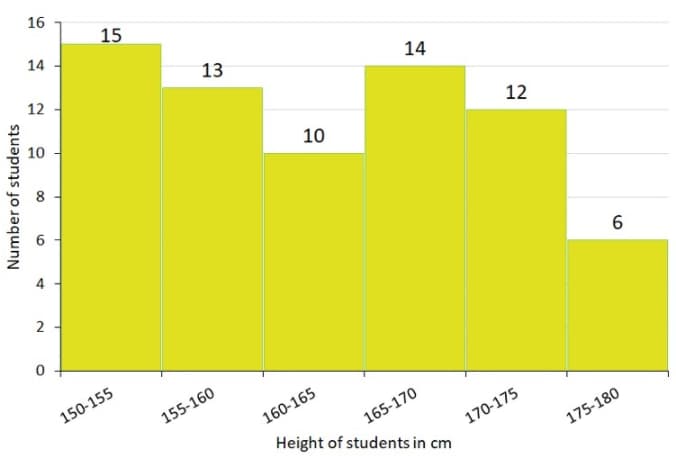
What is the percentage of students whose height is in the class interval ? (correct to the nearest integer)
The given histogram shows the frequency distribution of the speed of cars passing through at a particular spot on a highway. Study the graph and answer the question that follows.
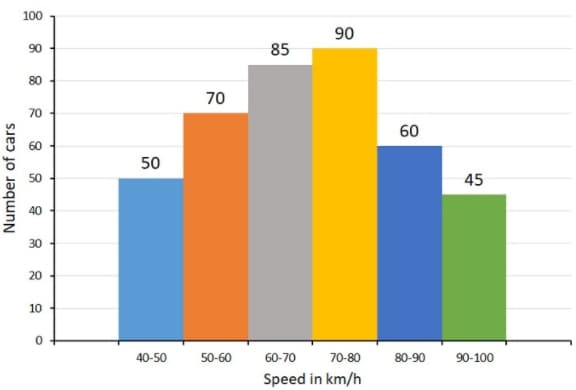
The number of cars with speed between and is what percentage more than the number of the cars with speed between and ? (correct to one decimal place)
The given histogram shows the frequency distribution of the speed of cars passing through at a particular spot on a highway. Study the graph and answer the question that follows.

What is the ratio of the number of cars with speed less than to the number of cars with speed more than ?


