
David Sang Solutions for Chapter: Describing Motion, Exercise 9: End-of-chapter questions
David Sang Physics Solutions for Exercise - David Sang Solutions for Chapter: Describing Motion, Exercise 9: End-of-chapter questions
Attempt the free practice questions on Chapter 2: Describing Motion, Exercise 9: End-of-chapter questions with hints and solutions to strengthen your understanding. Cambridge IGCSE® Physics Coursebook Second Edition solutions are prepared by Experienced Embibe Experts.
Questions from David Sang Solutions for Chapter: Describing Motion, Exercise 9: End-of-chapter questions with Hints & Solutions
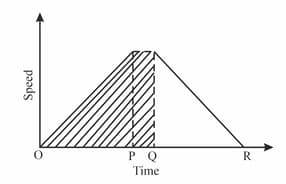
The diagram shows the route taken by a car and graph shows speed time graph for the car journey.
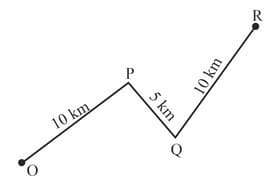
The car starts from rest at . State what the car was doing in the interval .
The diagram shows the route taken by a car and graph shows speed time graph for the car journey.
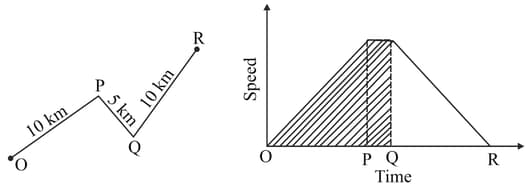
The car starts from rest at . Is the average speed during the journey same as maximum speed shown on the graph?
The graph is a distance/time graph shows motion of an object.

Describe the motion shown for the first seconds.
The graph is a distance/time graph shows motion of an object.
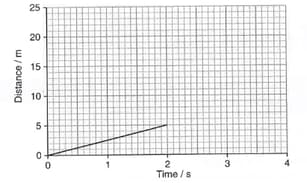
After the object accelerates. Sketch possible graph after .
The graph is a distance/time graph shows motion of an object.
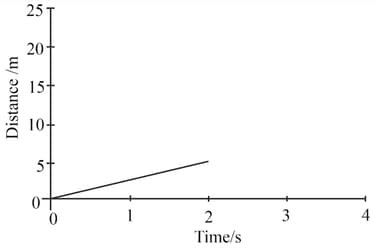
Describe how a distance time graph shows that an object is stationary.
The graph is a distance/time graph shows motion of an object. Draw a speed time graph for motion in seconds.
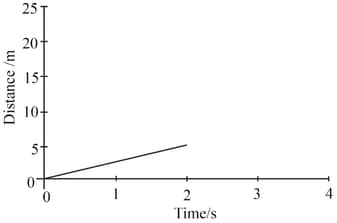
The graph is a distance/time graph shows motion of an object. Draw a speed time graph for next seconds if object is accelerating at .

Describe how a speed-time graph shows that an object is stationary.


