
David Sang and Graham Jones Solutions for Chapter: Practical Skills at A Level, Exercise 8: EXAM-STYLE QUESTIONS
David Sang Physics Solutions for Exercise - David Sang and Graham Jones Solutions for Chapter: Practical Skills at A Level, Exercise 8: EXAM-STYLE QUESTIONS
Attempt the practice questions on Chapter 33: Practical Skills at A Level, Exercise 8: EXAM-STYLE QUESTIONS with hints and solutions to strengthen your understanding. Physics for Cambridge International AS & A Level Coursebook 3rd Edition Digital Access solutions are prepared by Experienced Embibe Experts.
Questions from David Sang and Graham Jones Solutions for Chapter: Practical Skills at A Level, Exercise 8: EXAM-STYLE QUESTIONS with Hints & Solutions
The period of a simple pendulum is related to its length by the equation:
Where is the acceleration of free fall.
A student measures the time for oscillations for different lengths . This table shows her data.
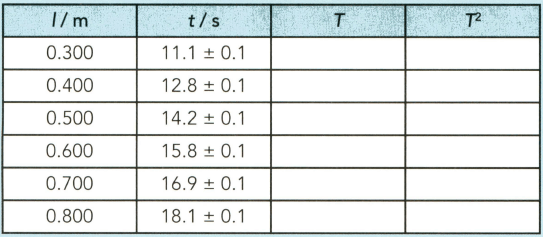
Using the value of and its uncertainty, calculate the value of when the length is . Include the absolute uncertainty in your answer.
Readings are taken of the resistance of a thermistor at different temperatures . It is suggested that the relationship between and is , where and are constants. A graph is plotted with on the y-axis and on the x-axis. State the value of the gradient and the y-intercept in terms of and .
Readings are taken of the resistance of a thermistor at different temperatures . It is suggested that the relationship between and is , where and are constants. Values for and are shown in the given table:
Complete the table and include absolute uncertainties in .
Readings are taken of the resistance of a thermistor at different temperatures . It is suggested that the relationship between and is , where and are constants.
Plot a graph of against .
Readings are taken of the resistance of a thermistor at different temperatures . It is suggested that the relationship between and is , where and are constants.
Draw the line of best fit and a worst acceptable line on your graph.
Readings are taken of the resistance of a thermistor at different temperatures . It is suggested that the relationship between and is , where and are constants.
Determine the gradient of your line of best fit and the uncertainty in your value.
Readings are taken of the resistance of a thermistor at different temperatures . It is suggested that the relationship between and is , where and are constants.
Determine the -intercept of your graph (this is where the -value, in this case, , is zero). Give the uncertainty in your value.
Readings are taken of the resistance of a thermistor at different temperatures . It is suggested that the relationship between and is , where and are constants.
Determine values for and and the uncertainties in your answers.


