
David Sang and Graham Jones Solutions for Chapter: Practical Skills at A Level, Exercise 6: Questions
David Sang Physics Solutions for Exercise - David Sang and Graham Jones Solutions for Chapter: Practical Skills at A Level, Exercise 6: Questions
Attempt the practice questions on Chapter 33: Practical Skills at A Level, Exercise 6: Questions with hints and solutions to strengthen your understanding. Physics for Cambridge International AS & A Level Coursebook 3rd Edition Digital Access solutions are prepared by Experienced Embibe Experts.
Questions from David Sang and Graham Jones Solutions for Chapter: Practical Skills at A Level, Exercise 6: Questions with Hints & Solutions
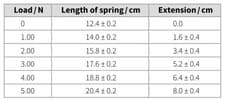
The values of load shown in table are given without any indication of their uncertainties. Suggest a reason for this.
A student measures the radius and the resistance of several equal lengths of wire. The results are shown in Table. It is suggested that and are related by the equation:
Where are constants.

A graph is plotted with on the -axis and on the -axis. Express the gradient and -intercept in terms of .
A student measures the radius and the resistance of several equal lengths of wire. The results are shown in Table. It is suggested that and are related by the equation:
Where are constants.
Values of measured in an experiment are given in Table.
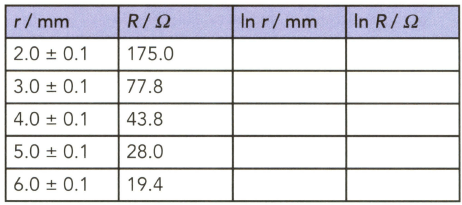
Copy and complete the table by calculating and recording values of and and include the absolute uncertainties in
A student measures the radius and the resistance of several equal lengths of wire. The results are shown in Table. It is suggested that and are related by the equation:
Where are constants.
Plot a graph of against . Include error bars for .
A student measures the radius and the resistance of several equal lengths of wire. The results are shown in Table. It is suggested that and are related by the equation:
Where are constants.
Draw the line of best fit and a worst acceptable straight line on your graph.
A student measures the radius and the resistance of several equal lengths of wire. The results are shown in Table. It is suggested that and are related by the equation:
Where are constants.
Determine the gradient of the line of best fit. Include the uncertainty in your answer.
A student measures the radius and the resistance of several equal lengths of wire. The results are shown in Table. It is suggested that and are related by the equation:
Where are constants.
Determine the value of according to the best fit line.
A student measures the radius and the resistance of several equal lengths of wire. The results are shown in Table. It is suggested that and are related by the equation:
Where are constants.
Determine the value of and its uncertainty.


