
David Weber, Talei Kunkel, Harriet Simand and, Justin Medved Solutions for Chapter: Percentages Inequality and Difference, Exercise 3: Visual representation of percentages
David Weber Mathematics Solutions for Exercise - David Weber, Talei Kunkel, Harriet Simand and, Justin Medved Solutions for Chapter: Percentages Inequality and Difference, Exercise 3: Visual representation of percentages
Attempt the practice questions on Chapter 2: Percentages Inequality and Difference, Exercise 3: Visual representation of percentages with hints and solutions to strengthen your understanding. MYP Mathematics A concept-based approach 1 solutions are prepared by Experienced Embibe Experts.
Questions from David Weber, Talei Kunkel, Harriet Simand and, Justin Medved Solutions for Chapter: Percentages Inequality and Difference, Exercise 3: Visual representation of percentages with Hints & Solutions
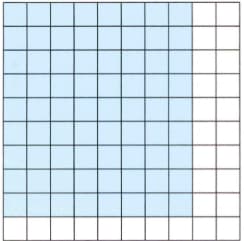
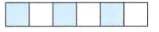
Write down the percentage represented by the shaded section of the following grid.
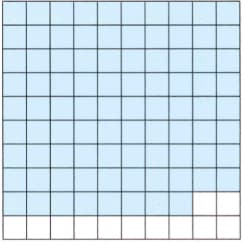
Write down the percentage represented by the shaded section of the following grid
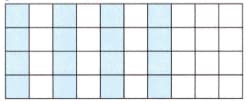
Write down the percentage represented by the shaded section of the following grid. Describe how you were able to identify the percentage for the grids that do not have 100 Squares
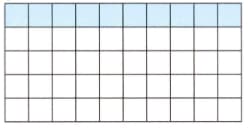
Write down the percentage represented by the shaded section of the following grid. Describe how you were able to identify the percentage for the grids that do not have 100 Squares
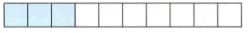
Write down the percentage represented by the shaded section of the following grid. Describe how you were able to identify the percentage for the grids that do not have 100 Squares
Write down the percentage represented by the shaded section of the following grid. Describe how you were able to identify the percentage for the grids that do not have Squares.
Create two of your own grids to represent .
Make a creative and unusual visual representation of .


