
Dean Chalmers and Julian Gilbey Solutions for Chapter: Measures of Variation, Exercise 3: EXERCISE 3A
Dean Chalmers Mathematics Solutions for Exercise - Dean Chalmers and Julian Gilbey Solutions for Chapter: Measures of Variation, Exercise 3: EXERCISE 3A
Attempt the practice questions on Chapter 3: Measures of Variation, Exercise 3: EXERCISE 3A with hints and solutions to strengthen your understanding. Cambridge International AS & A Level Mathematics : Probability & Statistics 1 Course Book solutions are prepared by Experienced Embibe Experts.
Questions from Dean Chalmers and Julian Gilbey Solutions for Chapter: Measures of Variation, Exercise 3: EXERCISE 3A with Hints & Solutions
The following table shows the cumulative frequencies for values of
Without drawing a cumulative frequency graph, find:
the interquartile range
The following table shows the cumulative frequencies for values of
Without drawing a cumulative frequency graph, find:
the percentile.
Fifty -gram samples of a particular type of mushroom are collected by volunteers at a university and tested. The following table shows the mass of toxins, in hundredths of a gram, in these samples.
| Mass | |||||
| No. samples |
Draw a cumulative frequency curve to illustrate the data.
Fifty -gram samples of a particular type of mushroom are collected by volunteers at a university and tested. The following table shows the mass of toxins, in hundredths of a gram, in these samples.
| Mass | |||||
| No. samples |
Use your curve to estimate, correct to decimal places:
i. the interquartile range
Fifty -gram samples of a particular type of mushroom are collected by volunteers at a university and tested. The following table shows the mass of toxins, in hundredths of a gram, in these samples.
| Mass | |||||
| No. samples |
Use your curve to estimate, correct to decimal places:
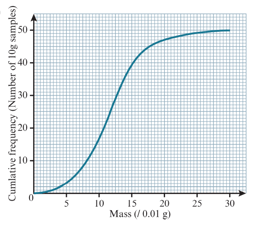
the range of the middle
Fifty -gram samples of a particular type of mushroom are collected by volunteers at a university and tested. The following table shows the mass of toxins, in hundredths of a gram, in these samples.
| Mass | |||||
| No. samples |
It was found that toxins made up between and of the mass of of these samples. Use your curve to estimate the value of

Fifty -gram samples of a particular type of mushroom are collected by volunteers at a university and tested. The following table shows the mass of toxins, in hundredths of a gram, in these samples.
| Mass | |||||
| No. samples |
Make an assessment of the variation in the percentage of toxic material in these samples. Can you suggest any possible reasons for such variation?
A -year study was carried out on the pollutants released when biomass fuels are used for cooking. Researchers offered nearly people living in villages in southern China access to clean biogas and to improved kitchen ventilation. Some people took advantage of neither; some changed to clean fuels; some improved their kitchen ventilation; and some did both. The following diagram shows data on the concentrations of nitrogen dioxide in these people's homes at the end of the study.
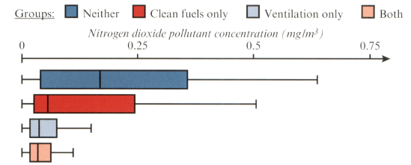
Study the data represented in the diagram and then write a brief analysis that summarises the results of this part of the study.


