
Dean Chalmers and Julian Gilbey Solutions for Chapter: Representation of Data, Exercise 10: END-OF-CHAPTER REVIEW EXERCISE 1
Dean Chalmers Mathematics Solutions for Exercise - Dean Chalmers and Julian Gilbey Solutions for Chapter: Representation of Data, Exercise 10: END-OF-CHAPTER REVIEW EXERCISE 1
Attempt the free practice questions on Chapter 1: Representation of Data, Exercise 10: END-OF-CHAPTER REVIEW EXERCISE 1 with hints and solutions to strengthen your understanding. Cambridge International AS & A Level Mathematics : Probability & Statistics 1 Course Book solutions are prepared by Experienced Embibe Experts.
Questions from Dean Chalmers and Julian Gilbey Solutions for Chapter: Representation of Data, Exercise 10: END-OF-CHAPTER REVIEW EXERCISE 1 with Hints & Solutions
The weights of sausages are summarised in the following table.
| Weight (grams) | |||||||
| Cumulative frequency |
State how many sausages weighed between and .
The capacities of ten engines, in litres, are given rounded to 2 decimal places, as follows:
and .
These capacities are to be grouped in three classes as and
.Find the frequency of the class litres.
Over a -day period, Alina recorded the number of text messages she received each day. The following stem-and-leaf diagram shows her results.
On how many days did she receive more than but not more than messages?
Eighty people downloaded a particular application and recorded the time taken for the download to complete. The times are given in the following table.
| Download time (min) | ||||
| No. downloads |
Find the number of downloads that completed in to minutes.
The histograms below illustrate the number of hours of sunshine during August in two regions, $A$ and $B$. Neither region had more than 8 hours of sunshine per day.
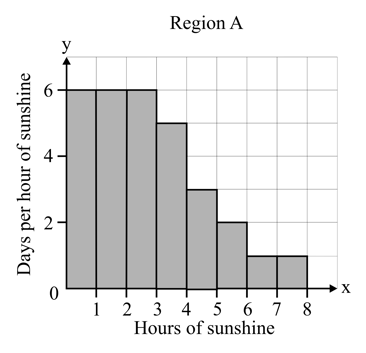
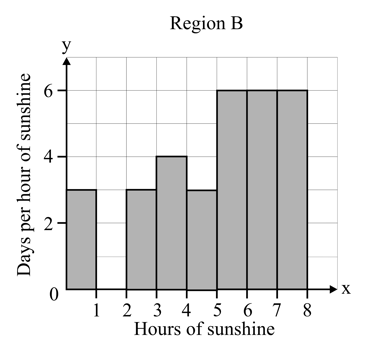
After studying the histograms, two students make the following statements.
- Bindu: There was more sunshine in region A than in region during the first weeks of August.
- Janet: In August there was less sunshine in region than in region .
Discuss these statements and decide whether or not you agree with each of them.In each case, explain your reasoning.
A hotel has rooms. The table summarises information about the number of rooms occupied each day for a period of days.
| Number of rooms occupied | ||||||
| Frequency |
Draw a cumulative frequency graph on graph paper to illustrate this information.
A hotel has rooms. The table summarises information about the number of rooms occupied each day for a period of days.
| Number of rooms occupied | ||||||
| Frequency |
Draw a cumulative frequency graph on graph paper to illustrate this information.
Estimate the number of days when more than rooms were occupied.
A hotel has rooms. The table summarises information about the number of rooms occupied each day for a period of days.
| Number of rooms occupied | ||||||
| Frequency |
Draw a cumulative frequency graph on graph paper to illustrate this information.
On of the days at most rooms were occupied. Estimate the value of.


