
Dean Chalmers and Julian Gilbey Solutions for Chapter: The Normal Distribution, Exercise 4: EXERCISE 8A
Dean Chalmers Mathematics Solutions for Exercise - Dean Chalmers and Julian Gilbey Solutions for Chapter: The Normal Distribution, Exercise 4: EXERCISE 8A
Attempt the free practice questions on Chapter 8: The Normal Distribution, Exercise 4: EXERCISE 8A with hints and solutions to strengthen your understanding. Cambridge International AS & A Level Mathematics : Probability & Statistics 1 Course Book solutions are prepared by Experienced Embibe Experts.
Questions from Dean Chalmers and Julian Gilbey Solutions for Chapter: The Normal Distribution, Exercise 4: EXERCISE 8A with Hints & Solutions
The probability distributions for and are represented in the diagram. Indicate whether each of the following statements is true or false.
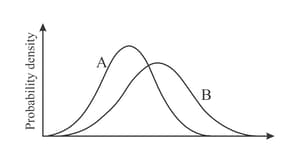
The probability distributions for and are represented in the diagram. Indicate whether each of the following statements is true or false.

The probability distributions for and are represented in the diagram. Indicate whether each of the following statements is true or false.

and have the same range of values.
The probability distributions for and are represented in the diagram. Indicate whether each of the following statements is true or false.

The probability distributions for and are represented in the diagram. Indicate whether each of the following statements is true or false.
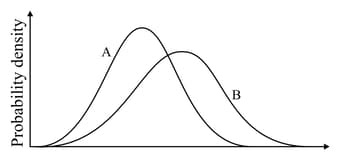
At least half of the values in are greater than
The probability distributions for and are represented in the diagram. Indicate whether each of the following statements is true or false.
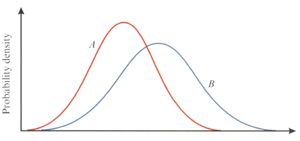
The values in two datasets, whose probability distributions are both normal curves, are summarised by the following totals:
and
and
Show that the centre of the curve for is located to the right of the centre of the curve for
The values in two datasets, whose probability distributions are both normal curves, are summarised by the following totals:
and
and
On the same diagram, sketch a normal curve for each dataset.


