
Dr. Sanjeev Verma and R.K. Tyagi Solutions for Chapter: Data Handling, Exercise 3: ASSIGNMENT 13.3
Dr. Sanjeev Verma Mathematics Solutions for Exercise - Dr. Sanjeev Verma and R.K. Tyagi Solutions for Chapter: Data Handling, Exercise 3: ASSIGNMENT 13.3
Attempt the practice questions on Chapter 13: Data Handling, Exercise 3: ASSIGNMENT 13.3 with hints and solutions to strengthen your understanding. Excellence in Mathematics solutions are prepared by Experienced Embibe Experts.
Questions from Dr. Sanjeev Verma and R.K. Tyagi Solutions for Chapter: Data Handling, Exercise 3: ASSIGNMENT 13.3 with Hints & Solutions
Read the bar graph given below carefully and answer the following question by choosing the correct option.

What was the production of cement in the year ?
Read the bar graph given below carefully and answer the following question by choosing the correct option.
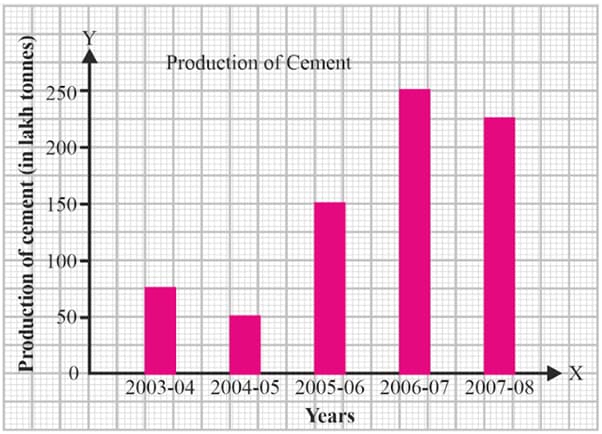
During which period, the production was minimum
Read the bar graph shown and answer the following question:
What is the general information given by the bar graph?
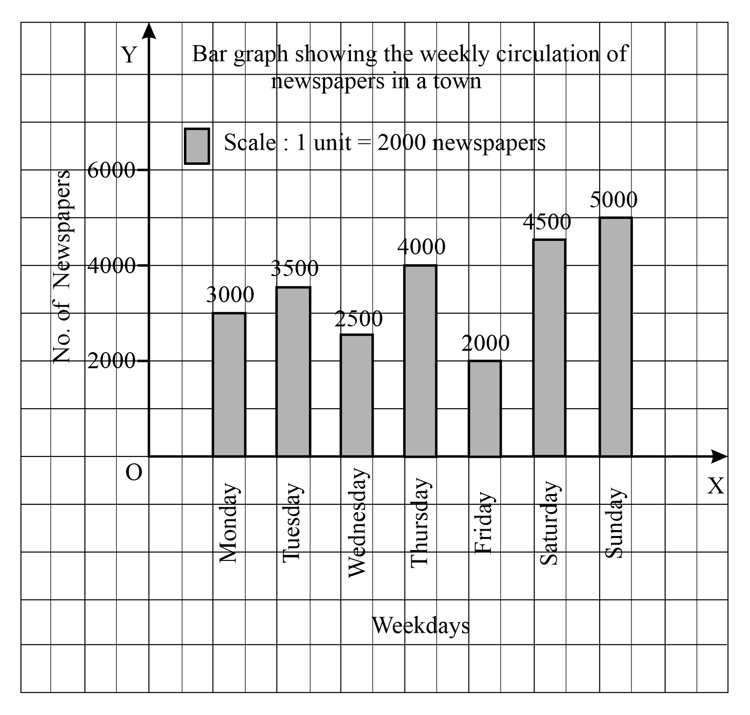
Read the bar graph shown and answer the following question:
On which day was the circulation maximum?

Read the bar graph shown and answer the following question:
On which day was the circulation minimum?
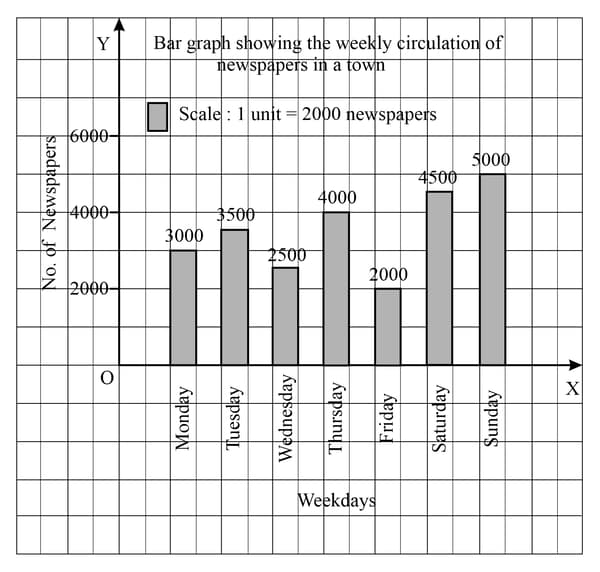
Read the bar graph shown and answer the following question:
On how many days was the circulation less than ?

Read the bar graph shown and answer the following question:
What the ratio of number of newspaper sold on Wednesday and on Sunday?

From the following table which shows marks obtained by students in a maths class test, draw a bar graph.
| Marks | |||||||
| Number of students |


