
Dr. Sanjeev Verma and R.K. Tyagi Solutions for Chapter: Data Handling, Exercise 2: ASSIGNMENT 14.2
Dr. Sanjeev Verma Mathematics Solutions for Exercise - Dr. Sanjeev Verma and R.K. Tyagi Solutions for Chapter: Data Handling, Exercise 2: ASSIGNMENT 14.2
Attempt the practice questions on Chapter 14: Data Handling, Exercise 2: ASSIGNMENT 14.2 with hints and solutions to strengthen your understanding. Excellence in Mathematics solutions are prepared by Experienced Embibe Experts.
Questions from Dr. Sanjeev Verma and R.K. Tyagi Solutions for Chapter: Data Handling, Exercise 2: ASSIGNMENT 14.2 with Hints & Solutions
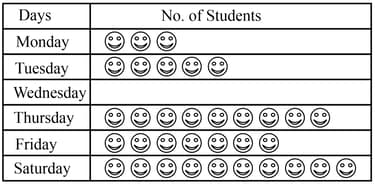
A pictograph is given below :

The no. of students present on Saturday is.
In the pictograph of,
The sale of electric bulbs on different days of a shop in a week is shown alongside as a pictograph :
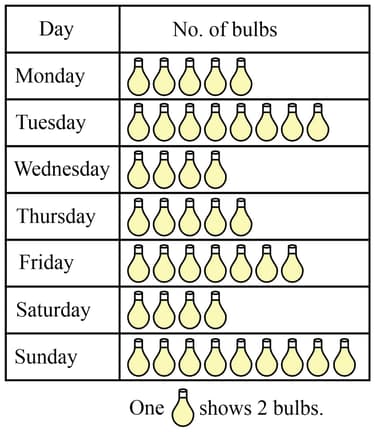
Observe the pictograph and answer the following questions :
If one big carton could hold bulbs, how many cartons were needed to hold the total bulbs sold in the given week?
Total number of students of a school in different years in shown in the following table.
Prepare a pictograph of students using one symbol  to represent 100 students and answer the following questions.
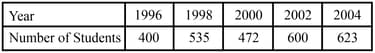
How many symbols represent the total number of students in the year 2002 ?
Total number of students of a school in different years in shown in the following table.
Prepare a pictograph of students using one symbol  to represent 100 students and answer the following questions.

How many symbols represent the total number of students for the year 1996 ?
A survey was carried out in a certain school to find about different modes of transport used by students to travel to school each day. students of class were interviewed and the data obtained was displayed in the form of an given pictograph.
Looking at the pictograph, answer the following questions:

What is the number of students who use scooter as a mode of travel ?
A survey was carried out in a certain school to find about different modes of transport used by students to travel to school each day. students of class were interviewed and the data obtained was displayed in the form of an given pictograph.
Looking at the pictograph, answer the following questions:

Find the number of students using cycle or walking as a mode of travel.
A survey was carried out in a certain school to find about different modes of transport used by students to travel to school each day. students of class were interviewed and the data obtained was displayed in the form of an given pictograph.
Looking at the pictograph, answer the following questions:
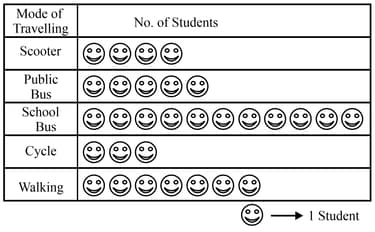
Which is the most popular mode of travel ?


