
Dr. Sanjeev Verma and R.K. Tyagi Solutions for Chapter: Data Handling, Exercise 3: ASSIGNMENT 14.3
Dr. Sanjeev Verma Mathematics Solutions for Exercise - Dr. Sanjeev Verma and R.K. Tyagi Solutions for Chapter: Data Handling, Exercise 3: ASSIGNMENT 14.3
Attempt the practice questions on Chapter 14: Data Handling, Exercise 3: ASSIGNMENT 14.3 with hints and solutions to strengthen your understanding. Excellence in Mathematics solutions are prepared by Experienced Embibe Experts.
Questions from Dr. Sanjeev Verma and R.K. Tyagi Solutions for Chapter: Data Handling, Exercise 3: ASSIGNMENT 14.3 with Hints & Solutions
Read the given bar graph and answer the following :

Name the person with the greatest number of heart beats per minute.
Read the given bar graph and answer the following :
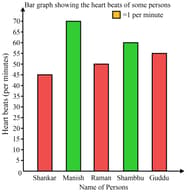
Find the number of heartbeats per minute for the person with the greatest number of heart beats per minute.
Read the given bar graph and answer the following :

Name the person with the least number of heart beats per minute.
Read the given bar graph and answer the following :

Find the number of heartbeats per minute for the person with the least number of heart beats per minute.
Read the given bar graph and answer the following :

What is the average number of heartbeats per minute for the five people named on the graph.
Following table shows the number of trees planted after every two years in a city during the years :
| Years | ||||||
| Number of trees planted |
Express this data in the form of a bar graph, taking unit length trees.
The number of Mathematics books sold by a shopkeeper on six consecutive days is shown below :
| Days | Sunday | Monday | Tuesday | Wednesday | Thursday | Friday |
| Number of Books sold |
Draw a bar graph to represent the above information choosing the suitable scale of your choice.
The following table shows the population of cities in lakh. Represent it in the form of a bar graph.


