
Embibe Experts Solutions for Chapter: Oscillations, Exercise 1: NEET - 17th July 2022
Embibe Experts Physics Solutions for Exercise - Embibe Experts Solutions for Chapter: Oscillations, Exercise 1: NEET - 17th July 2022
Attempt the free practice questions on Chapter 10: Oscillations, Exercise 1: NEET - 17th July 2022 with hints and solutions to strengthen your understanding. EMBIBE CHAPTER WISE PREVIOUS YEAR PAPERS FOR PHYSICS solutions are prepared by Experienced Embibe Experts.
Questions from Embibe Experts Solutions for Chapter: Oscillations, Exercise 1: NEET - 17th July 2022 with Hints & Solutions
Two pendulums of length and start vibrating in phase. At some instant, the two are at their mean position in the same phase. The minimum number of vibrations of the shorter pendulum after which the two are again in phase at the mean position is
A body is executing simple harmonic motion with frequency , the frequency of its potential energy is
A spring is stretched by by a force . The time period of the oscillations when a mass of is suspended by it is :
Identify the function which represents a periodic motion
The phase difference between displacement and acceleration of a particle in a simple harmonic motion is:
The displacement of a particle executing simple harmonic motion is given by,
Then, the amplitude of its oscillation is given by
The radius of circle, the period of revolution, initial position and sense of revolution are indicated in the figure.
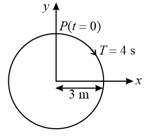
-projection of the radius vector of rotating particle is
The oscillation of a body on a smooth horizontal surface is represented by the equation, , where displacement at time , frequency of oscillation, acceleration at time and time period.
Which one of the following graph shows correctly the variation with ?


