
Embibe Experts Solutions for Chapter: Data Interpretation, Exercise 2: Exercise 2
Embibe Experts Quantitative Aptitude Solutions for Exercise - Embibe Experts Solutions for Chapter: Data Interpretation, Exercise 2: Exercise 2
Attempt the free practice questions on Chapter 3: Data Interpretation, Exercise 2: Exercise 2 with hints and solutions to strengthen your understanding. Embibe Quantitative Aptitude solutions are prepared by Experienced Embibe Experts.
Questions from Embibe Experts Solutions for Chapter: Data Interpretation, Exercise 2: Exercise 2 with Hints & Solutions
In the following table, the number of employees working in five companies and the corresponding ratio of male and female employees has been given. You are required to study the table carefully and answer the questions.
| COMPANY | NUMBER OF EMPLOYESS |
| L | 400 |
| M | 600 |
| N | 800 |
| O | 1000 |
| P | 1200 |
| COMPANY | MALE : FEMALE |
| L | 12:8 |
| M | 15:5 |
| N | 4:1 |
| O | 13:12 |
| P | 7:5 |
What is the average number of employees in all companies together?
Study the Pie-Chart given below and answer the questions-
Monthly expenses of a family
Total Salary per month
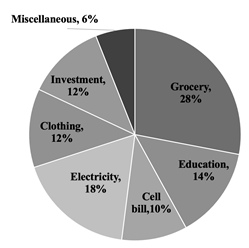
What is the difference in the amount by the family on electricity and cell bill?
The pie chart given below shows the monthly expenditure of a student.
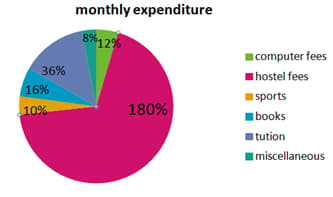
What is the central angle showing the expenditure on books?
DIRECTIONS : Study the following table and answer the question that follow:
|
School |
Number of students scoring marks less than |
Percentage of students scoring marks more than |
Number of students appeared |
|
A |
|
|
|
|
B |
|
|
|
|
C |
|
|
|
|
D |
|
|
|
|
E |
|
|
|
The total number of students scoring marks less than to that of scoring marks exactly , to find the ratio --
Directions: Assuming that the total production has not changed in these years. The distribution of production of 'Beautiful Gardens' or chards is given for the year and , answer the following question :
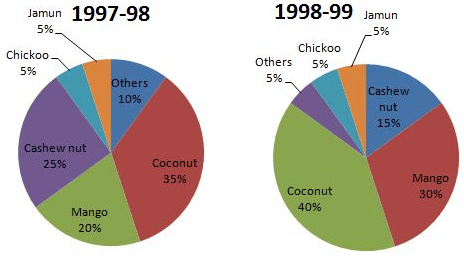
Which product has the highest growth in production?
The following pie chart cost of constructing one house. The total cost was .
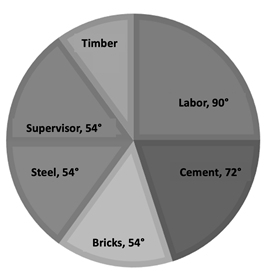
The amount spent on cement, steel and supervision is what percent of the total cost of construction?
The bar graph given below shows the sales of books (in a thousand number) from six branches of a publishing company during two consecutive years and
Sales of Books (in a thousand numbers) from Six Branches - and of a publishing Company in and
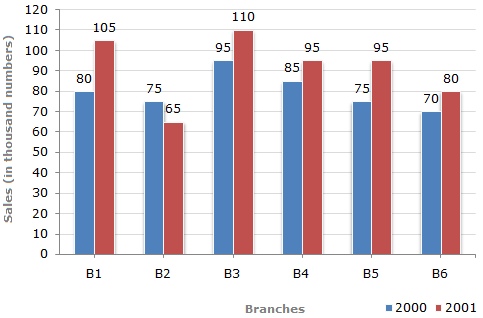
Total sales of branches and together for both the years (in thousand numbers) is ______.
Read the following graph carefully and answer the questions given below- Number of factories in various states in India and China.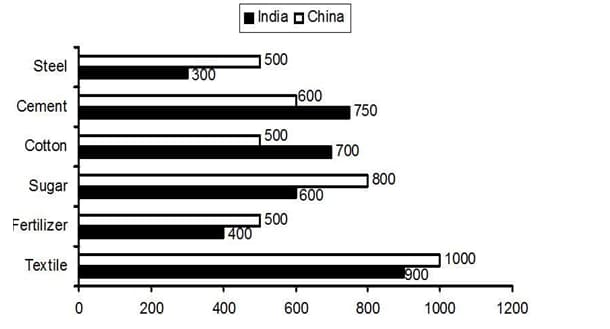
The number of Sugar industries in India is approximately what percentage of the total number of all industries in the same country?


