
Embibe Experts Solutions for Chapter: Data Interpretation, Exercise 2: Exercise 2
Embibe Experts Quantitative Aptitude Solutions for Exercise - Embibe Experts Solutions for Chapter: Data Interpretation, Exercise 2: Exercise 2
Attempt the free practice questions on Chapter 3: Data Interpretation, Exercise 2: Exercise 2 with hints and solutions to strengthen your understanding. Embibe Quantitative Aptitude solutions are prepared by Experienced Embibe Experts.
Questions from Embibe Experts Solutions for Chapter: Data Interpretation, Exercise 2: Exercise 2 with Hints & Solutions
The number of hours for which students of a particular class watched television during holidays is shown through the graph given below:
See the graph given and answer the following questions
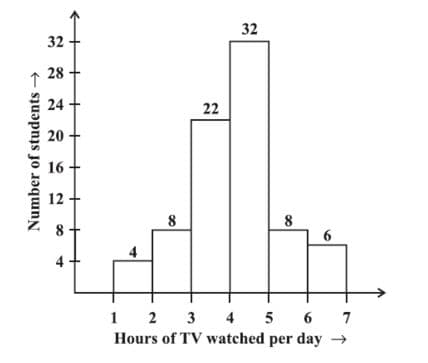
How many students spent less than in TV watching ?
Study the bar chart and answer the question below:
The bar graph provided below gives the data of the production of paper (in lakh tons) by three different companies over the years.
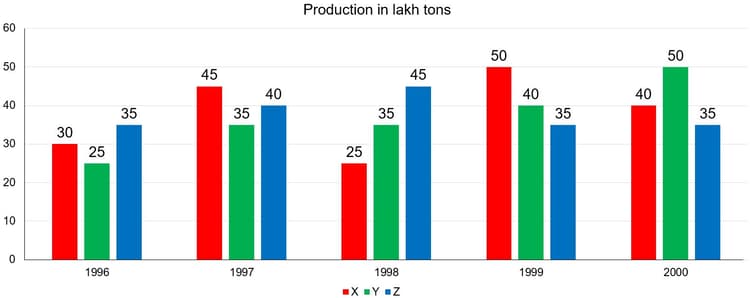
The average production for five years was maximum for which Company?
The marks obtained by examinees are shown by the frequency polygon. Given that mean marks is . Study the frequency polygon and answer the questions given below.
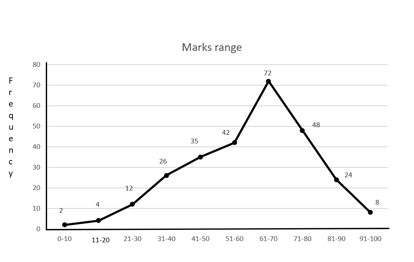
Percentage of the students who got marks above and below is -
Read the following graph carefully and answer the question given below:
Ratio of import and export of a company in different years
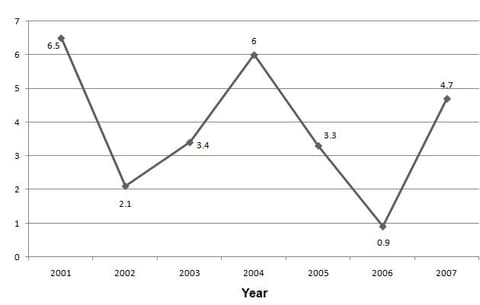
If the export was in , what will be the average export in all years together?
The following Pie-chart shows the land distributions of a housing complex. If the total area of the complex is , examine the pie chart and answer the question.
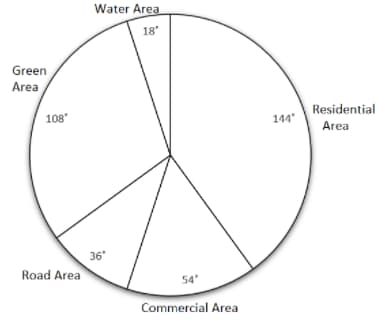
Land allotted for the green zone is greater than that for commercial purpose by _____.
Directions The pie chart given below shows the expenditure incurred in bringing out a book by a publisher.
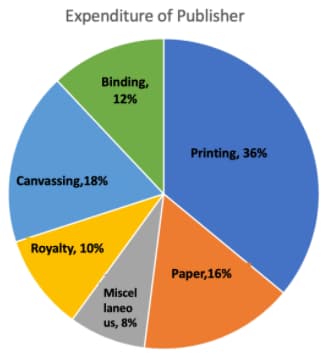
Study the graph and answer the questions given below:
If miscellaneous expenditures amount to , the expenditure on canvassing will be:
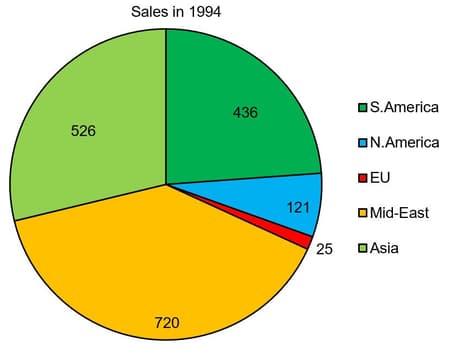
The following pie-chart gives sales of DRI Pellets in million tonnes.
The below pie chart shows the sales of DRI pellets in .
The below pie chart shows the sales of DRI pellets in the year .
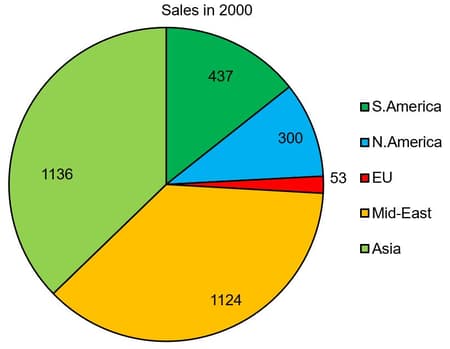
Which region is expected to have the highest percentage increase in sales over levels?
A Savings bank in a large city published the following graph depicting the amount of assets of one year in their monthly magazine:
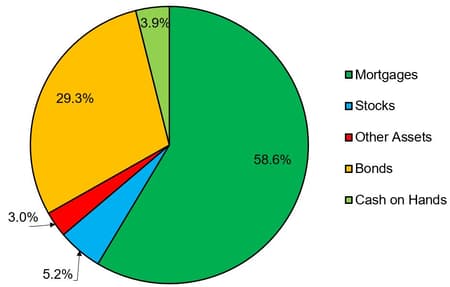
The annual rate of interest from other assets is , If the annual total assets of the bank are , What is the income from other assets?


