
Embibe Experts Solutions for Chapter: Data Interpretation, Exercise 3: Exercise 3
Embibe Experts Quantitative Aptitude Solutions for Exercise - Embibe Experts Solutions for Chapter: Data Interpretation, Exercise 3: Exercise 3
Attempt the free practice questions on Chapter 3: Data Interpretation, Exercise 3: Exercise 3 with hints and solutions to strengthen your understanding. Embibe Quantitative Aptitude solutions are prepared by Experienced Embibe Experts.
Questions from Embibe Experts Solutions for Chapter: Data Interpretation, Exercise 3: Exercise 3 with Hints & Solutions
Read the table and answer the question given below:
The following table shows the number of bicycles manufactured in a factory during the year to ,
| Years | The number of bicycles manufactured: |
In which year was the minimum number of bicycles manufactured ?
Study the following table and answer the questions based on it:
The data is (In )
| XYZ CO. PVT. LTD | |||
| Years | Total sales | Gross profit | Net profit |
| 1990 | 351.6 | 155.5 | 54.2 |
| 1991 | 407.9 | 134.3 | 42.6 |
| 1992 | 380.1 | 149.9 | 38.9 |
| 1993 | 439.7 | 160.5 | 50.3 |
| 1994 | 485.9 | 203.3 | 65.8 |
Which years show increase in all categories simultaneously i.e., total sales, gross profit and net profit as compared to the previous year?
Study the following table and answer the questions based on it: The data is (In )
| XYZ CO. PVT. LTD | |||
| Years | Total sales | Gross profit | Net profit |
| 1990 | 351.6 | 155.5 | 54.2 |
| 1991 | 407.9 | 134.3 | 42.6 |
| 1992 | 380.1 | 149.9 | 38.9 |
| 1993 | 439.7 | 160.5 | 50.3 |
| 1994 | 485.9 | 203.3 | 65.8 |
The percent increase in the gross profit was the largest in which year as compared to the previous one?
The table that is given below gives us the information about the North, east, west, south zone wise survey report of the people of a country who consumes coffee.
| Take Coffee | Zone | |||
| North | East | West | South | |
| More than time a day | ||||
| to times a day | ||||
| Twice a week | ||||
| Only once a week | ||||
| Never | ||||
Find the percentage of people from north-west zone who take coffee 'only once a week' (approximately)?
Study the following table carefully and answer the questions given below.
Various foodgrains sold by various sold by various farmer at various prices (₹ per )
| Farmer | Rice | corn | Bajra | Paddy | Jowar |
| A | 30 | 22.5 | 22 | 24 | 18 |
| B | 36 | 28 | 24.5 | 25 | 24 |
| C | 40 | 24 | 21 | 26 | 20.5 |
| D | 34.5 | 27.5 | 28 | 25 | 25 |
| E | 36 | 32 | 30 | 28.5 | 27 |
What is the average price per of Bajra sold by all the farmers together?
The following table gives the enrolment in higher secondary schools in . study the table carefully and answer these questions.
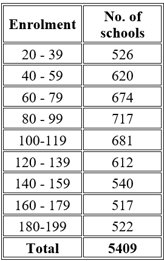
What is the approximate percentage of the least number of schools for the class of enrolment?
The following table gives the enrolment in higher secondary schools in study the table carefully and answer these questions.
|
Enrolment |
Number of schools |
|
|
|
|
|
|
|
|
|
|
|
|
|
|
|
|
|
|
|
|
|
|
|
|
|
|
|
|
Total |
|
What is the approximate percentage of schools, where the enrolment was below ?
Refer the table below and answer the following questions related to the table
| Year | World export | Export of Developed World | Export of Developing world | Exports of Petroleum exporting nations |
| 1989 | 3000 | 2150 | 650 | 160 |
| 1990 | 3450 | 2400 | 740 | 200 |
| 1991 | 3520 | 2500 | 790 | 198 |
| 1992 | 3614 | 2650 | 850 | 210 |
During the period , what percentage of world exports was the exports of the Developing World?


